Home / Site analysis / Walkability & accessibility
Walkability & accessibility

Walkability and accessibility analysis

How easy it is to reach your site on foot and by public transport, and what can be reached from it: walking times along the real streets, the stops within five, ten and fifteen minutes, routes to the nearest school, shop and park, and the places where people stop on the way.

Real street networkTransit stops from OSMIsochrones & 15-minute citySVG · PDF · PNG
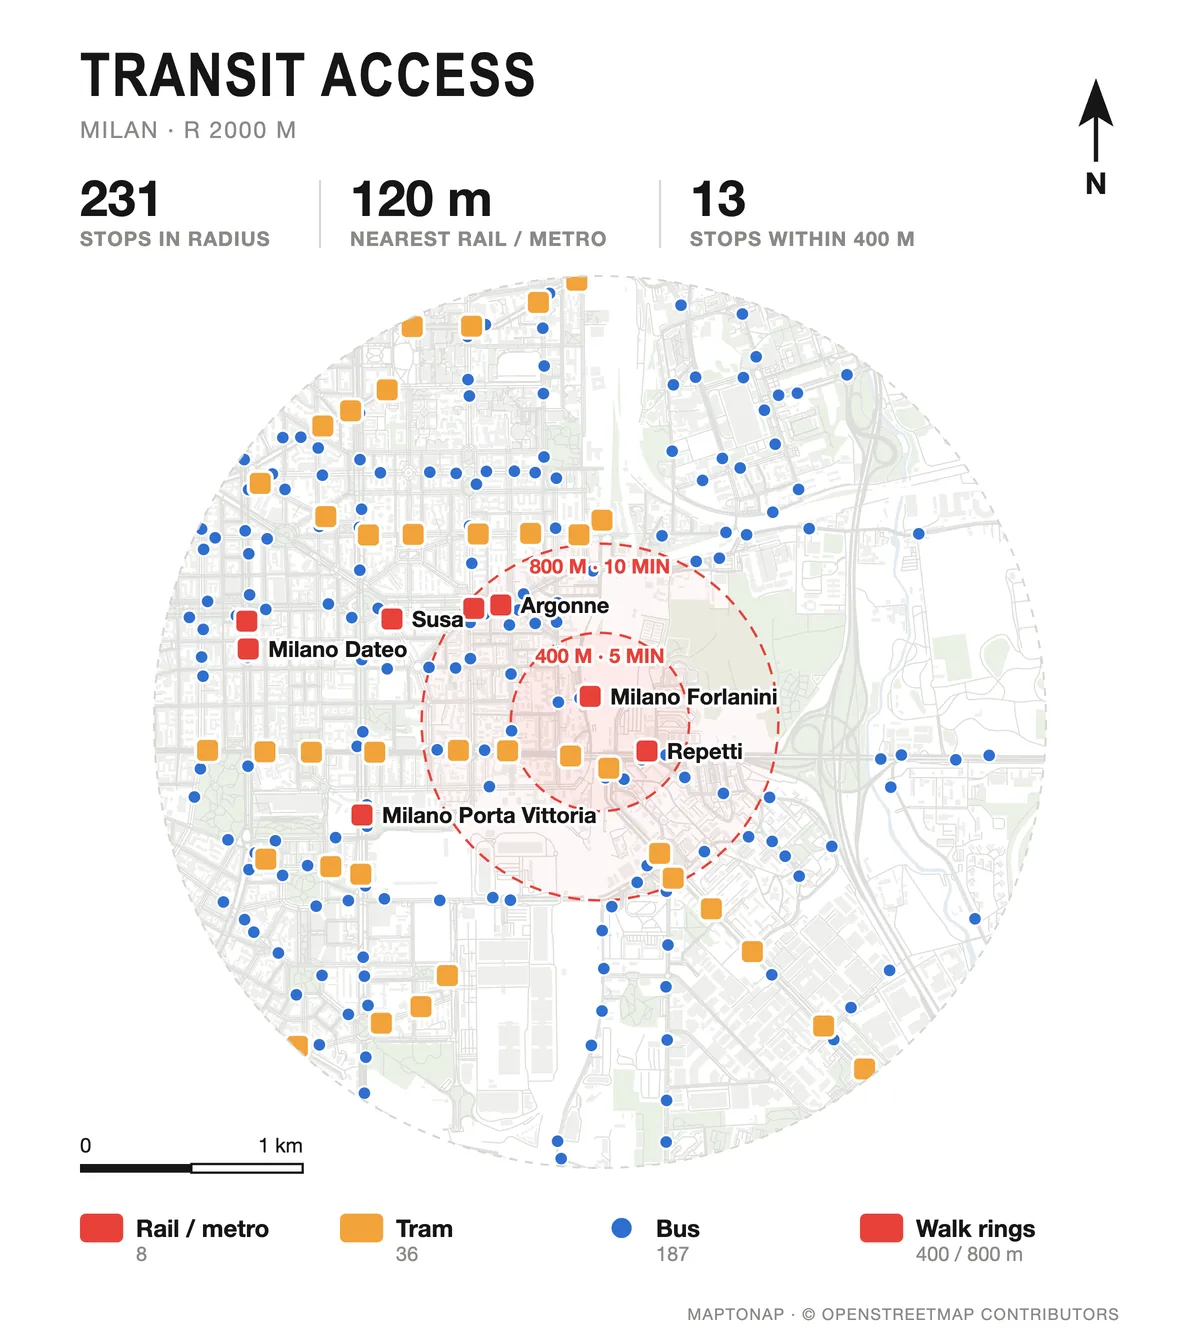
Transit access drawing of Milan with stops and walking rings, generated in MapToNap
What you can make

The drawings, and what each one shows

Access analysis (Pro)

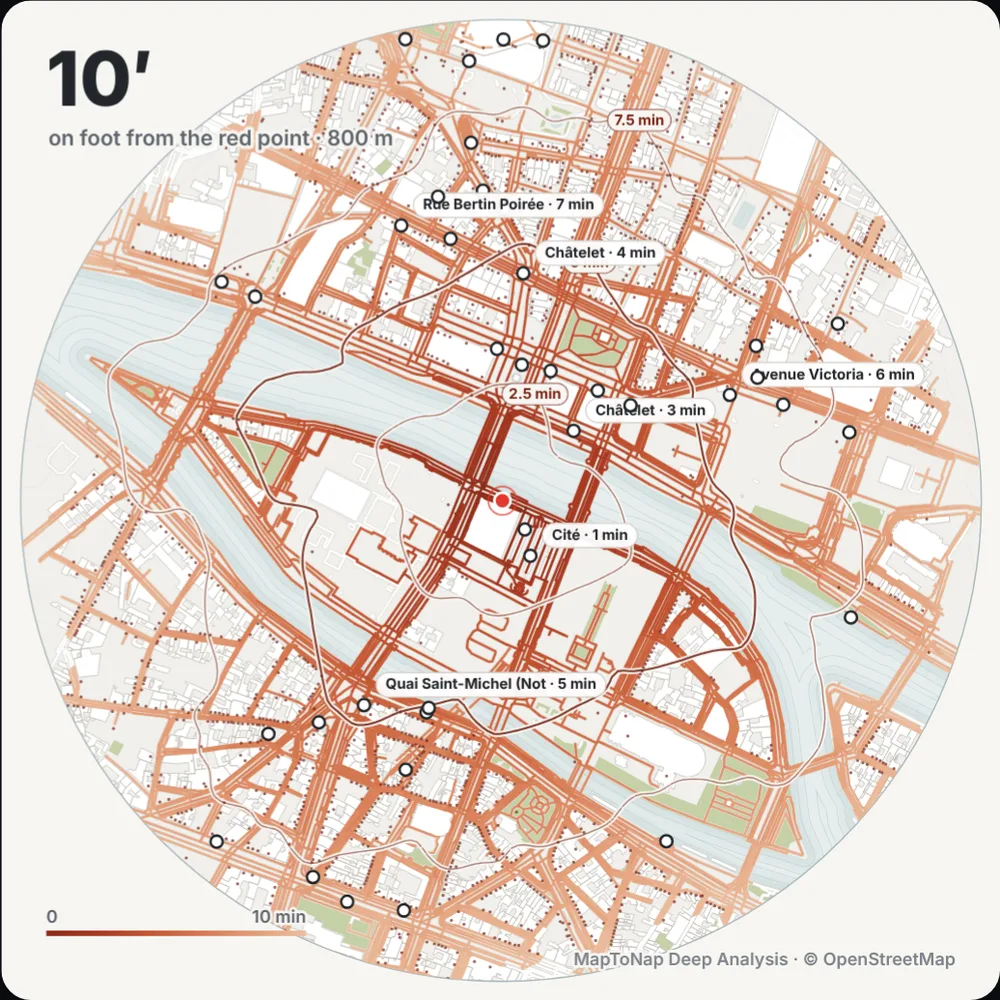
Walking time from the site along the street network, in 5, 10, 15 and 20-minute bands.

Transit access (Pro)

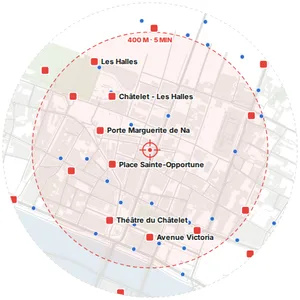
Rail, metro, tram and bus stops with 5, 10 and 15-minute walking rings around the site.

Walk accessibility (Pro)

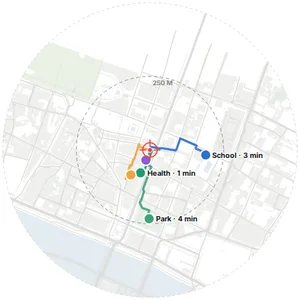
Real street routes from the site to the nearest everyday destinations, with their walking times.

Pedestrian network (Pro)

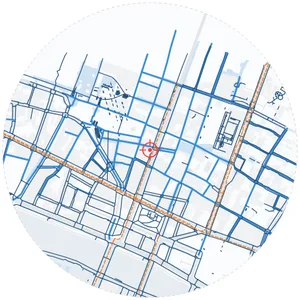
Footways, paths, pedestrian streets and squares: the part of the network made for walking.

Stay places & connections (Max)

Clusters of cafés, squares, parks and markets where people stop, linked by the shortest walking routes, with the entrances to the area.

Isochrones and the 15-minute city (Max)

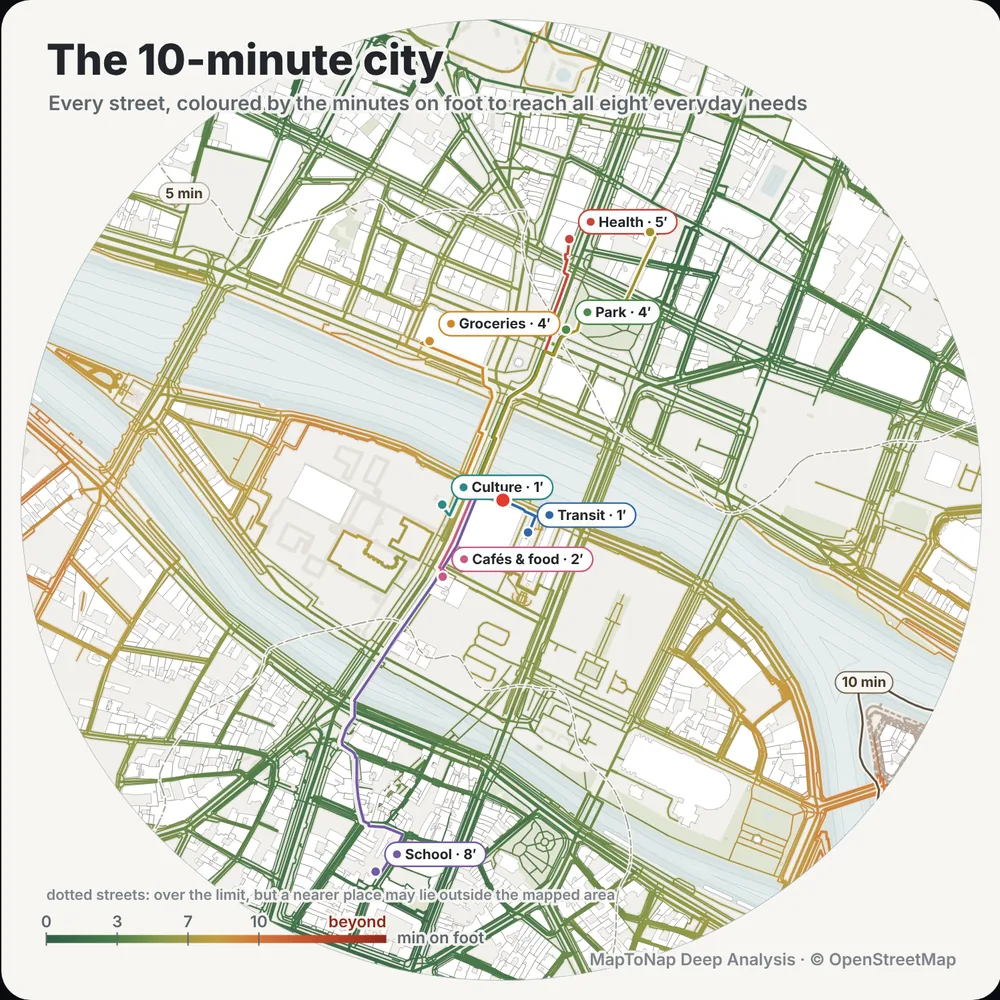
Deep Analysis computes walking isochrones on the street network and what daily needs are within 15 minutes.

Examples

Straight out of MapToNap

Untouched exports from real sites. Free drawings carry a watermark; Pro and Max drawings are marked.

Map data © OpenStreetMap contributors, available under the Open Database Licence. The images are MapToNap output.

Guide

How to analyse walkability around a site

  1. Measure along streets, not in circles. A 400 m circle overstates what is reachable where blocks are large or rivers and railways cut the network. Walking times along the streets show the real catchment.
  2. Map the transit. About 400 m (five minutes) to a bus stop and 800 m (ten minutes) to a rail station are common planning rules of thumb; show which stops fall inside them.
  3. Check everyday destinations. School, food shop, pharmacy, park: the walking time to the nearest of each says more about daily life than a density figure.
  4. Look at the quality of the walk. Footways, pedestrian streets and squares, and the places where people stop, show where walking is pleasant and where it is only possible.
  5. Conclude for the site. Where people will arrive from, which entrance faces them and which missing link the project could add.
Frequently asked questions

Before you start

What is a walking isochrone?

A line or area that joins all points reachable within the same walking time from a place, measured along the street network. MapToNap draws walking-time bands in the Access analysis and computes isochrones in Deep Analysis.

Where does the transit data come from?

Stops and stations come from OpenStreetMap. Timetables and frequencies are not included, so the drawings show access to stops, not service levels.

What is the 15-minute city?

A planning idea that daily needs, such as food, school, health, parks and work, should be reachable within 15 minutes on foot or by bike. Deep Analysis (Max) maps which of them are within that time of your site.

Is it free?

You can try MapToNap free: four 2D drawings (roads, land use, green and water, urban fabric) and one 3D drawing, with a watermark and no sign-up. Without the watermark and with all 68 analyses there are one-time passes: Pro €7.99 or Max €12.99 for 30 days, or a year of Max for €49. Nothing renews automatically.

Do I need to install anything? Does it work on a phone?

No installation and no setup. MapToNap runs in the browser on any computer, tablet or phone, iPhone or Android: open maptonap.com/app, type an address and press Generate. 3D drawings and simulations run smoothest on a computer.

Related

Keep going