Where does the urban growth data come from?
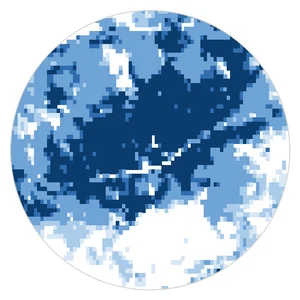
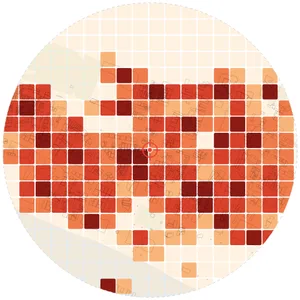
From GHS-BUILT-S R2023A, part of the Global Human Settlement Layer of the European Commission Joint Research Centre, released under CC BY 4.0. It gives the built-up surface of every cell of about 90 m, worldwide, for ten epochs from 1975 to 2020.
Does it show the age of each building?
No. It shows when each cell of about 90 m became built-up, which describes the growth of districts. For the age of individual buildings, use local historical maps or cadastral records.
Does it work outside Europe?
Yes. The dataset is global, so the drawing works in any city.
Is it free?
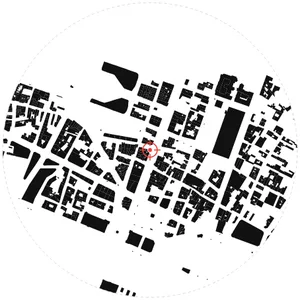
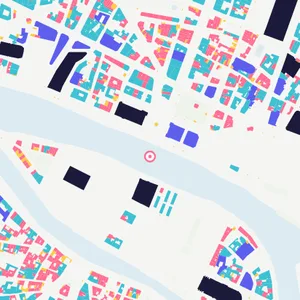
You can try MapToNap free: four 2D drawings (roads, land use, green and water, urban fabric) and one 3D drawing, with a watermark and no sign-up. Without the watermark and with all 68 analyses there are one-time passes: Pro €7.99 or Max €12.99 for 30 days, or a year of Max for €49. Nothing renews automatically.
Do I need to install anything? Does it work on a phone?
No installation and no setup. MapToNap runs in the browser on any computer, tablet or phone, iPhone or Android: open maptonap.com/app, type an address and press Generate. 3D drawings and simulations run smoothest on a computer.