Where does the elevation data come from?
From the open Terrain Tiles on AWS (Tilezen), which merge national and global elevation models such as SRTM, 3DEP and EU-DEM. MapToNap samples a grid over the site and masks out the buildings.
How the ground rises and falls around your site: contours over a relief, where water runs downhill, and stacked ground profiles that show the shape of the land at a glance. Elevation comes from open terrain data with the buildings masked out, and the drawing tells you when the data cannot tell the ground from the roofs.
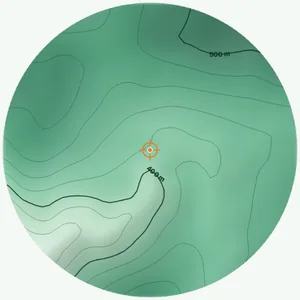
Elevation contours over a smooth relief with hillshade from the north-west, and the elevation range of the site.
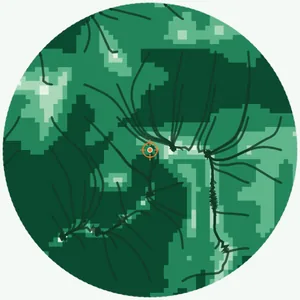
Streamlines that follow the steepest way down, thicker where the ground is steeper: where water will run.
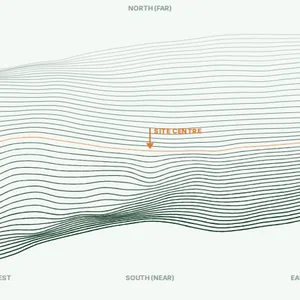
Stacked ground profiles across the site, a quick section-like reading of the landform.
Central & Accessible and the Zoning Plan draw the terrain contours under their own content.
Export the ground with the buildings to Rhino 3DM, OBJ or GLB for your own model.
In very dense areas, where the elevation model records roofs instead of ground, the drawing says it cannot separate the ground rather than drawing roofs as hills.
Untouched exports from real sites. Free drawings carry a watermark; Pro and Max drawings are marked.
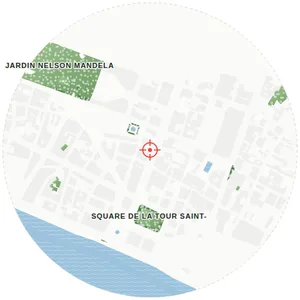
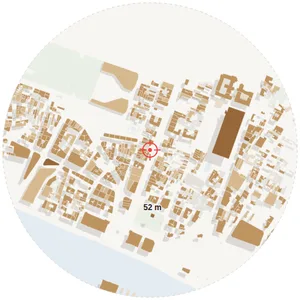
Map data © OpenStreetMap contributors, available under the Open Database Licence. The images are MapToNap output.
From the open Terrain Tiles on AWS (Tilezen), which merge national and global elevation models such as SRTM, 3DEP and EU-DEM. MapToNap samples a grid over the site and masks out the buildings.
The resolution depends on the source available for the region, from national models in the US and Europe to global ones elsewhere. It is good for reading the landform, not for exact levels; use a topographic survey for those.
Some elevation models record the top of buildings. In very dense areas too little open ground is left to rebuild the terrain, so MapToNap says so instead of drawing roofs as hills.
You can try MapToNap free: four 2D drawings (roads, land use, green and water, urban fabric) and one 3D drawing, with a watermark and no sign-up. Without the watermark and with all 68 analyses there are one-time passes: Pro €7.99 or Max €12.99 for 30 days, or a year of Max for €49. Nothing renews automatically.
No installation and no setup. MapToNap runs in the browser on any computer, tablet or phone, iPhone or Android: open maptonap.com/app, type an address and press Generate. 3D drawings and simulations run smoothest on a computer.