Home / Site analysis / Opportunities & constraints
Opportunities & constraints

Opportunities and constraints diagram

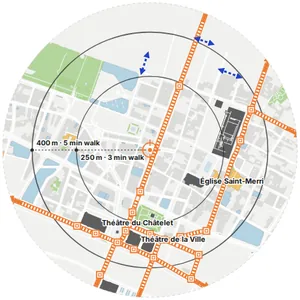
The sheet that closes a site analysis: what the site can build on and what it has to deal with. MapToNap draws land use, main streets, rail and walking radii, and suggests possible new connections where a dead-end street comes close to another one. The other analyses give you the evidence for each arrow.

Land use · movement · walking radiiPossible connections suggestedLabelled as suggestionsSVG · PDF · PNG
Opportunities and constraints diagram of a site with land use, main streets and walking radii, generated in MapToNap
What you can make

The drawings, and what each one shows

Opportunities & constraints (Max)

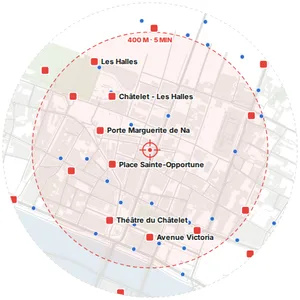
Land use from OpenStreetMap areas and building uses, main streets and rail, and walking radii at 80 m per minute around the site.

Possible connections

Dead-end streets that come within 15 to 70 m of another street with no building in between, drawn and labelled as suggestions from the network.

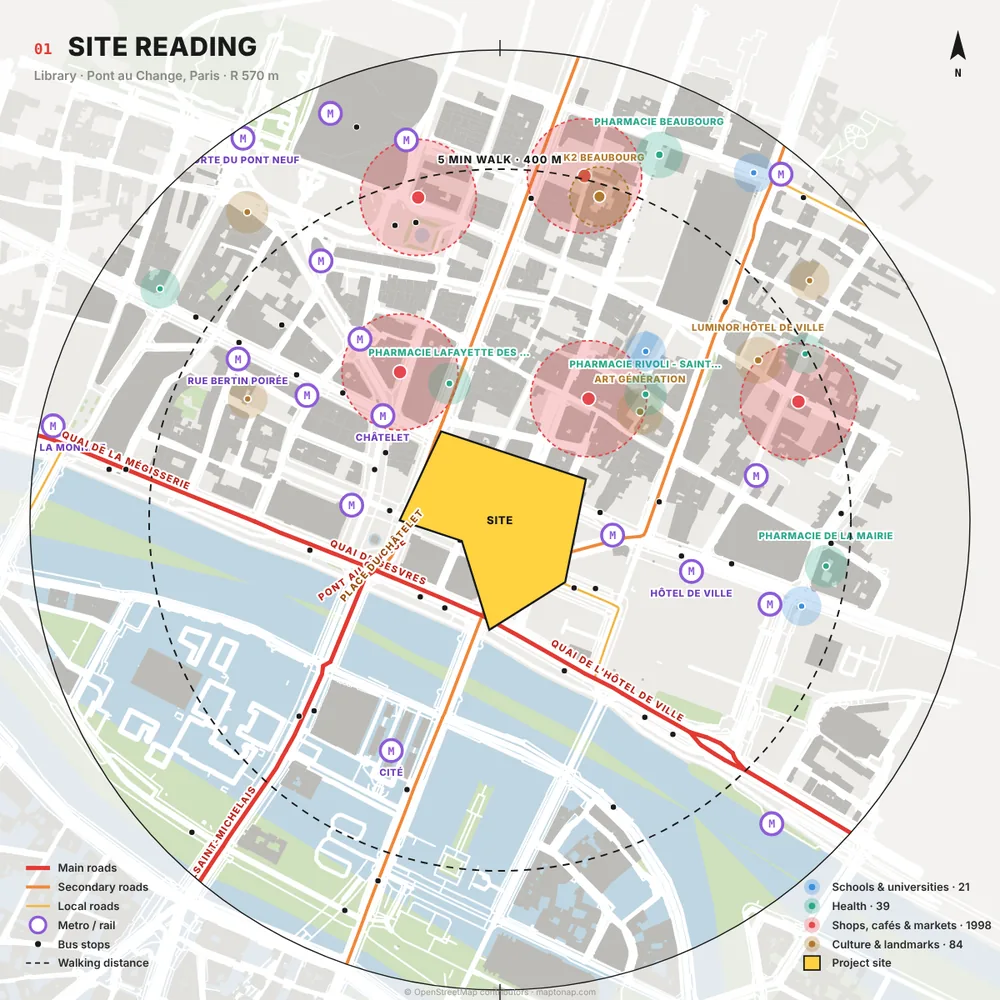
Site reading (Max)

In Site to Design, every edge of your plot: the street it faces, noise, sun, the nearest stop and green.

Constraints to back it up

Noise from road class, prevailing wind, slope and drainage, and the shadow of the neighbours.

Opportunities to back it up

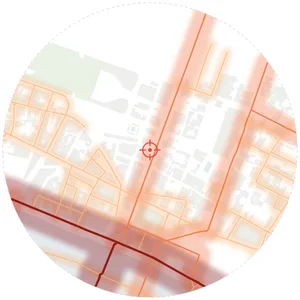
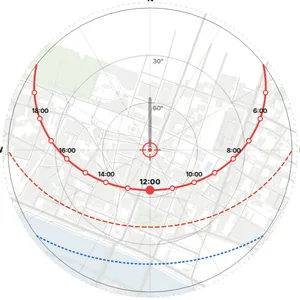
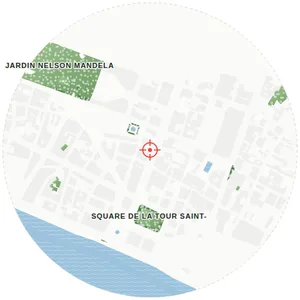
Sun path, green and water nearby, transit within walking distance, activity centres and lively streets.

One style for the set

The closing sheet uses the same palette as the analyses it summarises, so the board reads as one argument.

Examples

Straight out of MapToNap

Untouched exports from real sites. Free drawings carry a watermark; Pro and Max drawings are marked.

Map data © OpenStreetMap contributors, available under the Open Database Licence. The images are MapToNap output.

Guide

How to make an opportunities and constraints diagram

  1. Collect the conditions. Go through the analyses and write down every condition that affects the design: noise, sun, views, access, slope, neighbours, uses, green.
  2. Sort them. An opportunity is something the project can use; a constraint is something it must respect or fix. Some conditions are both, such as a busy street that brings people and noise.
  3. Map them, do not list them. Put each condition where it happens: the noisy edge, the sunny corner, the stop people arrive from, the missing link.
  4. Draw the response. Arrows for access and views, hatching for buffers, symbols for entrances. The diagram should already hint at the design.
  5. Back each mark with evidence. Place the analysis that proves each point next to it on the board, so the jury sees where the arrows come from.
Frequently asked questions

Before you start

What is an opportunities and constraints diagram?

A site analysis drawing that maps the conditions a project can build on (opportunities) and those it must respect or solve (constraints), such as access, sun, noise, views, slope and neighbouring uses. It usually closes the analysis and leads into the design strategy.

Is it the same as a SWOT analysis?

They are related. SWOT lists strengths, weaknesses, opportunities and threats, often in a table; an opportunities and constraints diagram puts the same kind of conditions on the site plan, where they happen.

Are the possible connections real proposals?

No. They are suggestions found in the street network, where a dead end comes close to another street with no building in between, and they are labelled as such. Whether a link can be built depends on ownership, levels and planning.

Is it free?

You can try MapToNap free: four 2D drawings (roads, land use, green and water, urban fabric) and one 3D drawing, with a watermark and no sign-up. Without the watermark and with all 68 analyses there are one-time passes: Pro €7.99 or Max €12.99 for 30 days, or a year of Max for €49. Nothing renews automatically.

Do I need to install anything? Does it work on a phone?

No installation and no setup. MapToNap runs in the browser on any computer, tablet or phone, iPhone or Android: open maptonap.com/app, type an address and press Generate. 3D drawings and simulations run smoothest on a computer.
Related

Keep going