Where does the climate data come from?
From NASA POWER, a global dataset of daily weather and solar radiation. MapToNap reads the daily record from 2014 to 2023 for the coordinates of your site and averages it by month.
The climate of your site in the same graphic language as the rest of the board: monthly highs and lows, rainfall, a climograph, solar radiation and the prevailing winds, from ten years of daily NASA POWER records for the coordinates of the site. Then see how it plays out around the buildings with wind and heat drawings.
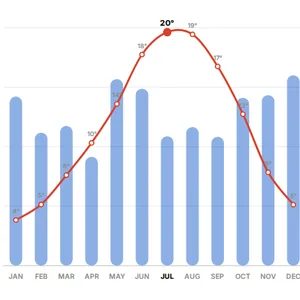
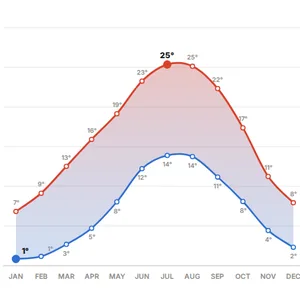
Mean daily high and low for every month, with the daily range.
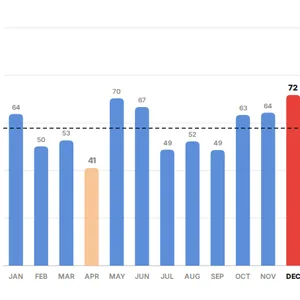
Monthly rainfall in millimetres, with the wettest and driest month.
Temperature and rainfall on one chart, the classic climograph for a site analysis.
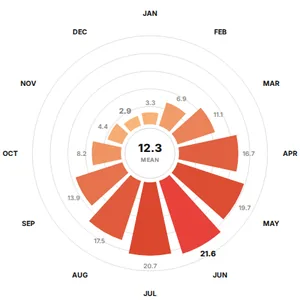
Monthly shortwave radiation on the ground in MJ/m² per day.
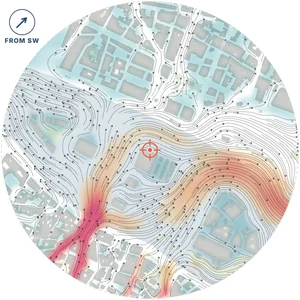
The prevailing directions from ten years of NASA POWER wind data, drawn around the blocks of the site. No CFD.
A 2D lattice Boltzmann simulation around the real buildings on your graphics card, and 3D streamlines at 2, 14 and 28 m.
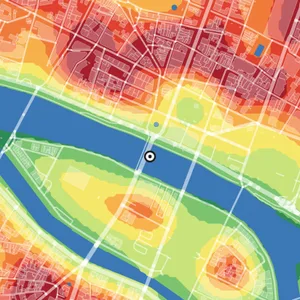
A relative heat index from what covers the ground (roofs, paving, trees, water), smoothed over about 60 m. Not a temperature, and the drawing says so.
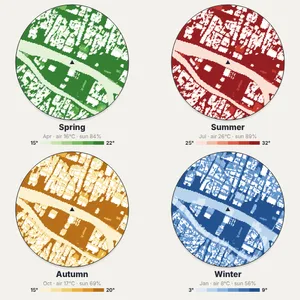
A simplified feels-like map in sun, shade and wind for each season, as an early-design reference rather than a comfort model.
Untouched exports from real sites. Free drawings carry a watermark; Pro and Max drawings are marked.
Map data © OpenStreetMap contributors, available under the Open Database Licence. The images are MapToNap output.
From NASA POWER, a global dataset of daily weather and solar radiation. MapToNap reads the daily record from 2014 to 2023 for the coordinates of your site and averages it by month.
It describes the regional climate on a coarse global grid, which is what a site analysis climate section needs. It does not capture the microclimate of a street or a courtyard; for that, see the wind, heat and seasons drawings, which are marked as estimates.
Not for these drawings. For energy or daylight simulation in dedicated software you will still use a weather file such as EPW.
No. It is a simplified 2D lattice Boltzmann simulation for early design, run in your browser. It shows sheltered areas and corridors; it does not replace an engineering wind assessment.
You can try MapToNap free: four 2D drawings (roads, land use, green and water, urban fabric) and one 3D drawing, with a watermark and no sign-up. Without the watermark and with all 68 analyses there are one-time passes: Pro €7.99 or Max €12.99 for 30 days, or a year of Max for €49. Nothing renews automatically.
No installation and no setup. MapToNap runs in the browser on any computer, tablet or phone, iPhone or Android: open maptonap.com/app, type an address and press Generate. 3D drawings and simulations run smoothest on a computer.