What is a POI in site analysis?
A point of interest: a mapped place such as a shop, café, school, clinic, stop or park. In site analysis, POIs show which facilities are around the site, how dense they are and where activity concentrates.
Shops, cafés, schools, clinics, stops and parks around your site, counted and drawn: by category, as a density heat map, along the streets they make lively, as centres where they cluster, and as the catchments each service covers. Every point is a mapped place from OpenStreetMap.
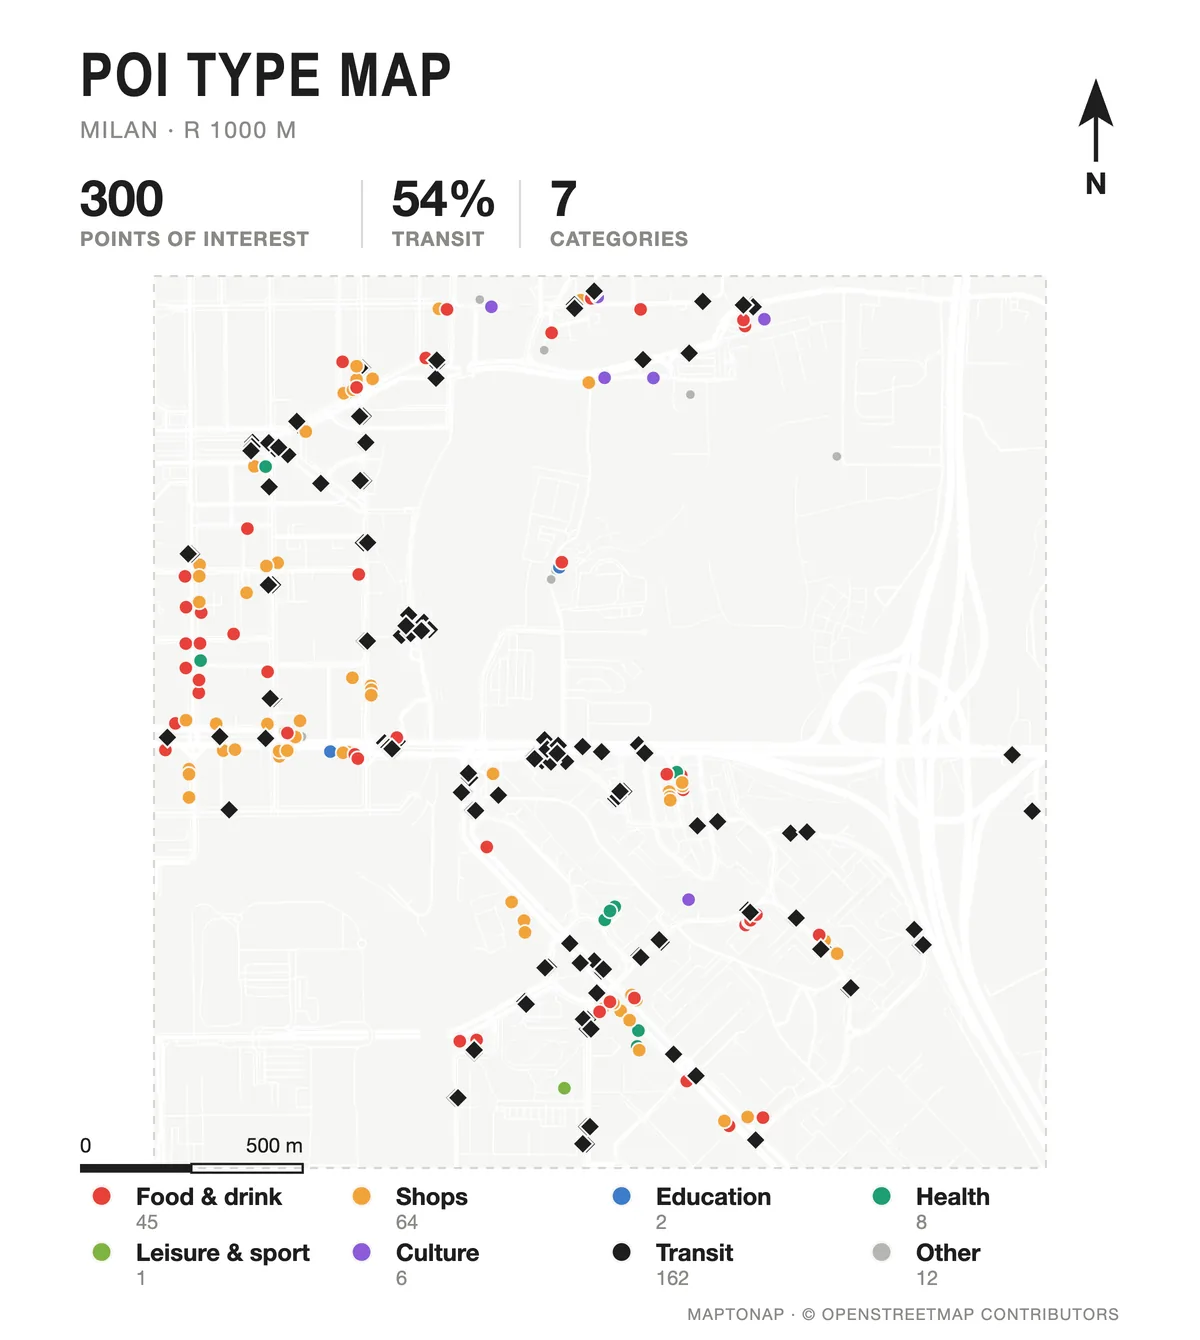
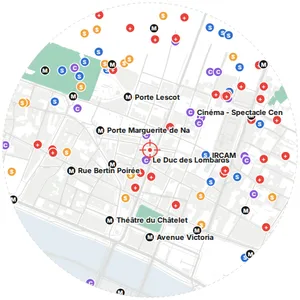
Amenities by category, and a poster version with category badges and the streets with the most shops and food.
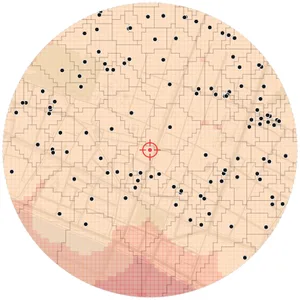
Amenities, shops, leisure, tourism and offices counted per grid cell: where facilities concentrate.
Places within 25 m of a street per 100 m of its length: which streets are lined with activity.
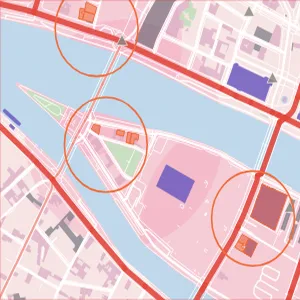
The density peaks of each kind of facility, drawn as rings: where food, culture or services cluster.
Voronoi catchments of the nearest transit stop, school, food shop or service, with the gaps between them.
The nearest facilities of each kind, labelled on the real map around the site.
Four places around the site with their opening hours from OpenStreetMap and what happens there.
POI and transit nodes, POI counts per grid cell, and building coverage against amenities per hexagon.
Untouched exports from real sites. Free drawings carry a watermark; Pro and Max drawings are marked.
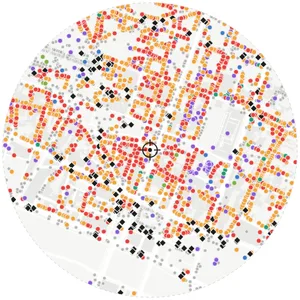
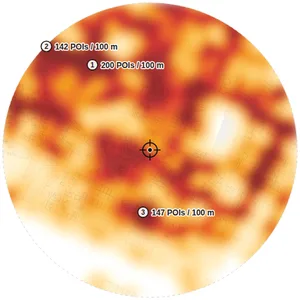
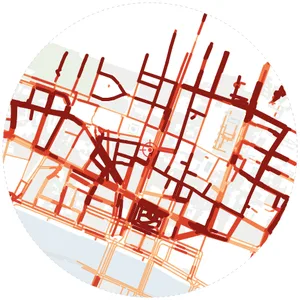
Map data © OpenStreetMap contributors, available under the Open Database Licence. The images are MapToNap output.
A point of interest: a mapped place such as a shop, café, school, clinic, stop or park. In site analysis, POIs show which facilities are around the site, how dense they are and where activity concentrates.
From OpenStreetMap. Coverage is very good in most European and many other cities but not complete everywhere; the drawings count what is mapped and never invent places.
Places & Times (Max) reads the opening hours tagged in OpenStreetMap for four places around the site. Places without tagged hours are counted as such.
You can try MapToNap free: four 2D drawings (roads, land use, green and water, urban fabric) and one 3D drawing, with a watermark and no sign-up. Without the watermark and with all 68 analyses there are one-time passes: Pro €7.99 or Max €12.99 for 30 days, or a year of Max for €49. Nothing renews automatically.
No installation and no setup. MapToNap runs in the browser on any computer, tablet or phone, iPhone or Android: open maptonap.com/app, type an address and press Generate. 3D drawings and simulations run smoothest on a computer.