Home / Site analysis / Axonometric & exploded diagrams
Axonometric & exploded diagrams

Axonometric diagrams from real building heights

Type an address and MapToNap draws the city around your site in axonometric: every building at its mapped height, styled for a presentation board. Choose a coloured context model, a clean line axonometric, an isometric massing study, magnified callouts, or pull the layers apart into an exploded axonometric of streets, uses and fabric.

Real building heights8 axonometric drawingsExploded layer stacksPNG · SVG · PDF
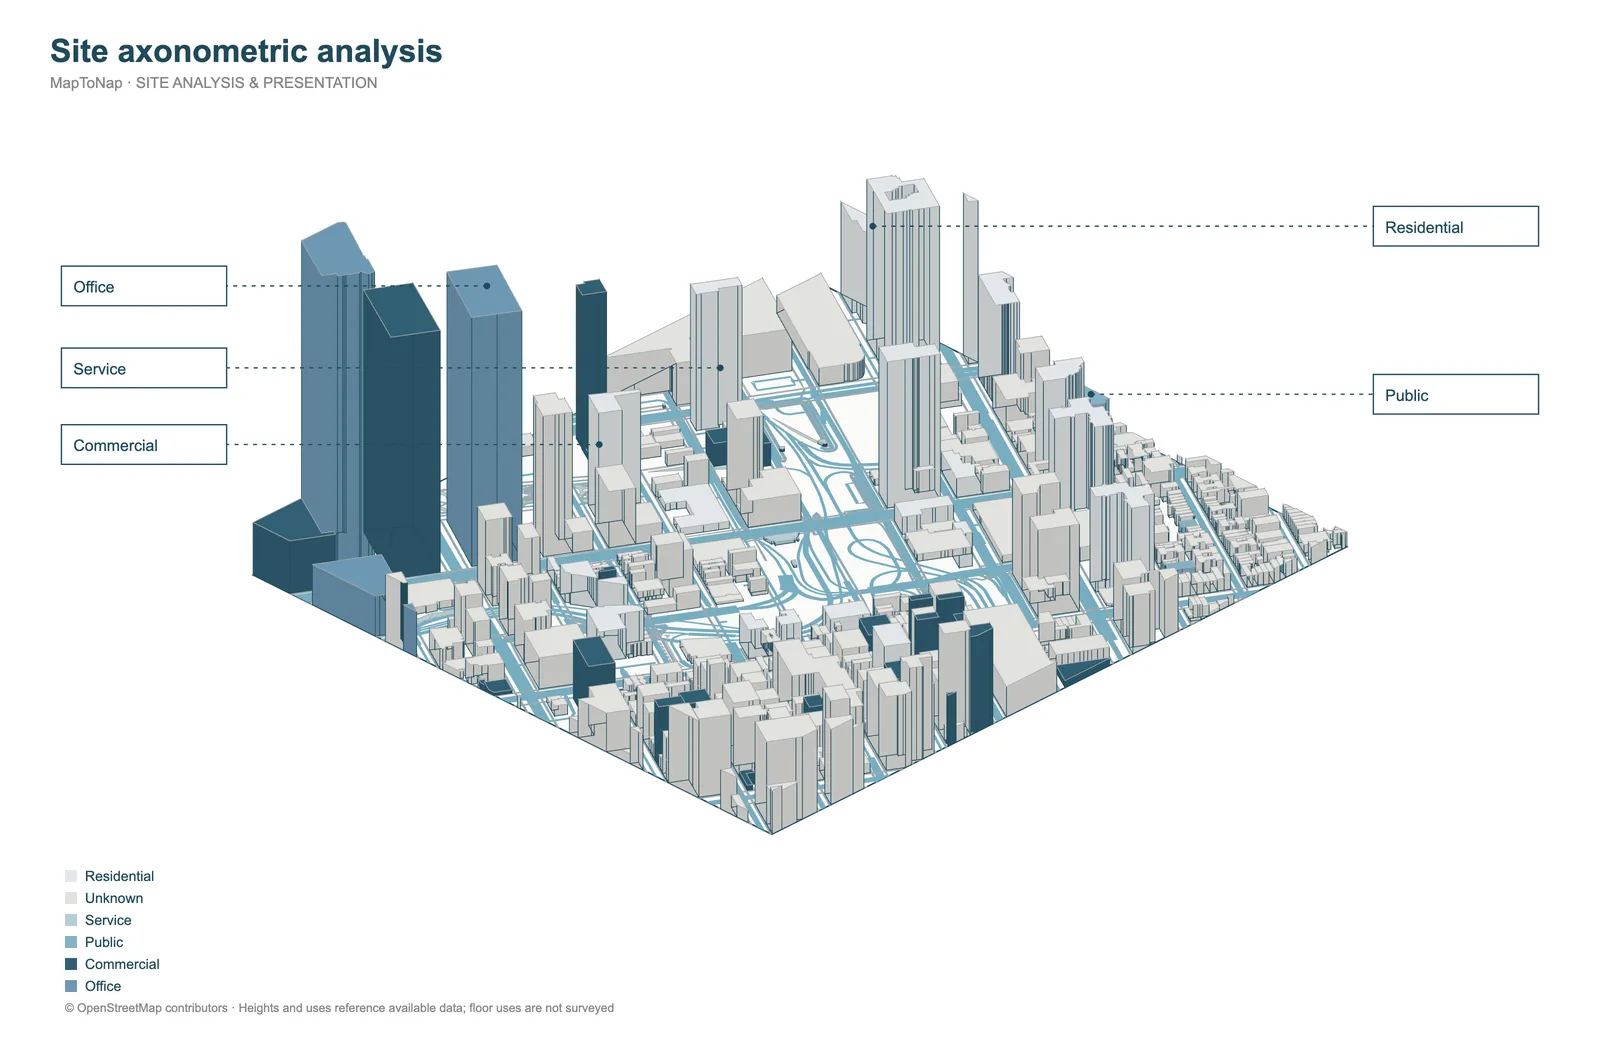
Site axonometric analysis board with office, residential, commercial and public buildings, generated in MapToNap
What you can make

The drawings, and what each one shows

Urban context axonometric (free)

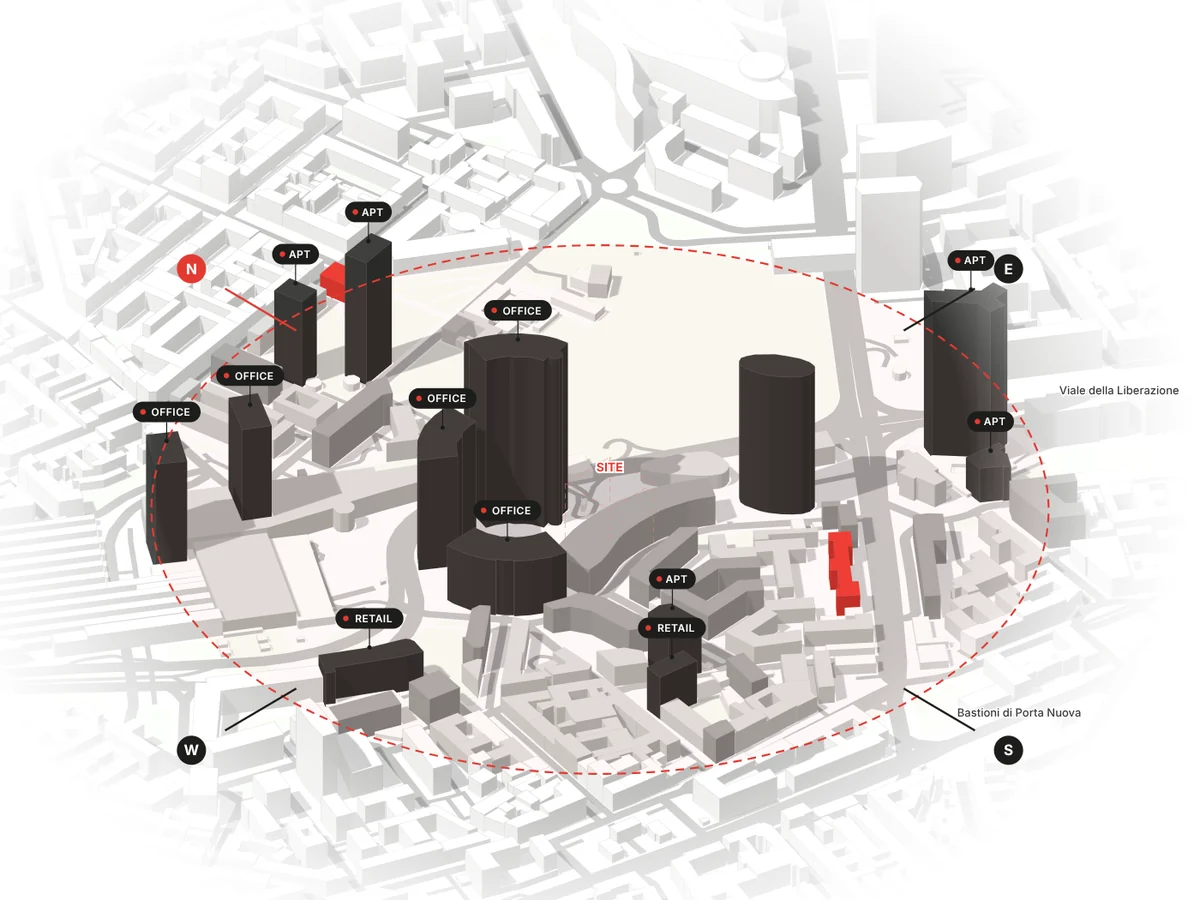
The city around the site in 3D, buildings coloured by number of floors, the uses of the tallest labelled, with a north-south and a west-east section.

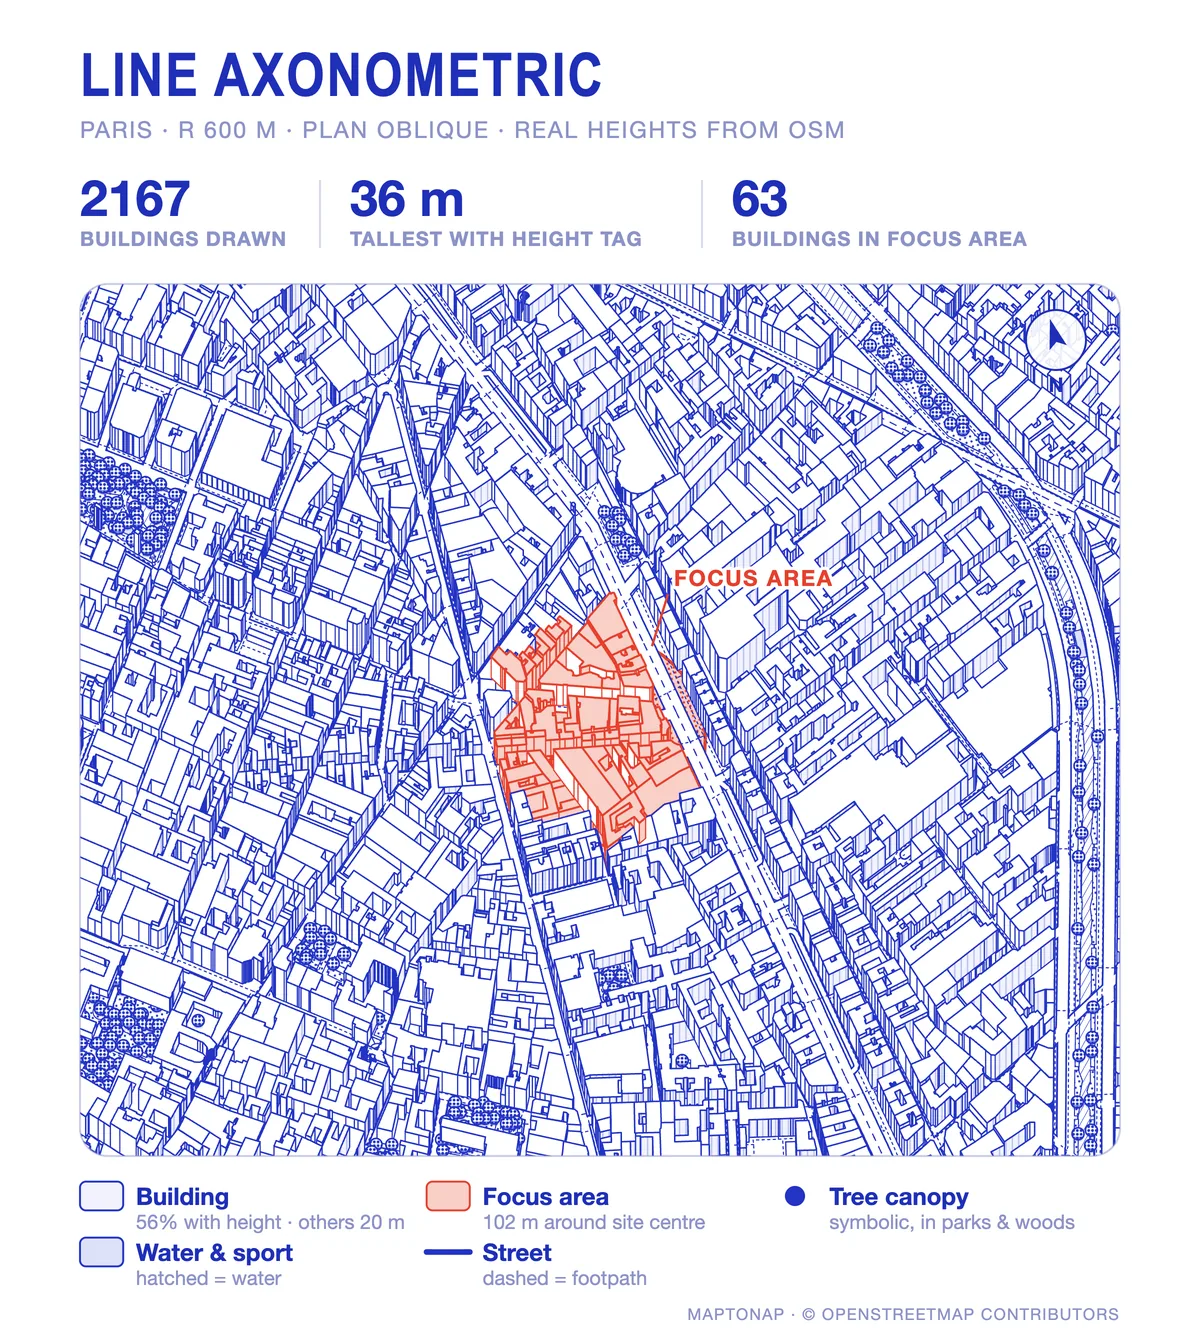
Line axonometric (Max)

A plan-oblique line drawing at real heights with the focus area in red: the classic black-and-white context axo for a board.

Isometric massing (Pro)

Every building extruded at 30° isometric with semi-transparent overlap, so you can read heights, density and gaps in one view.

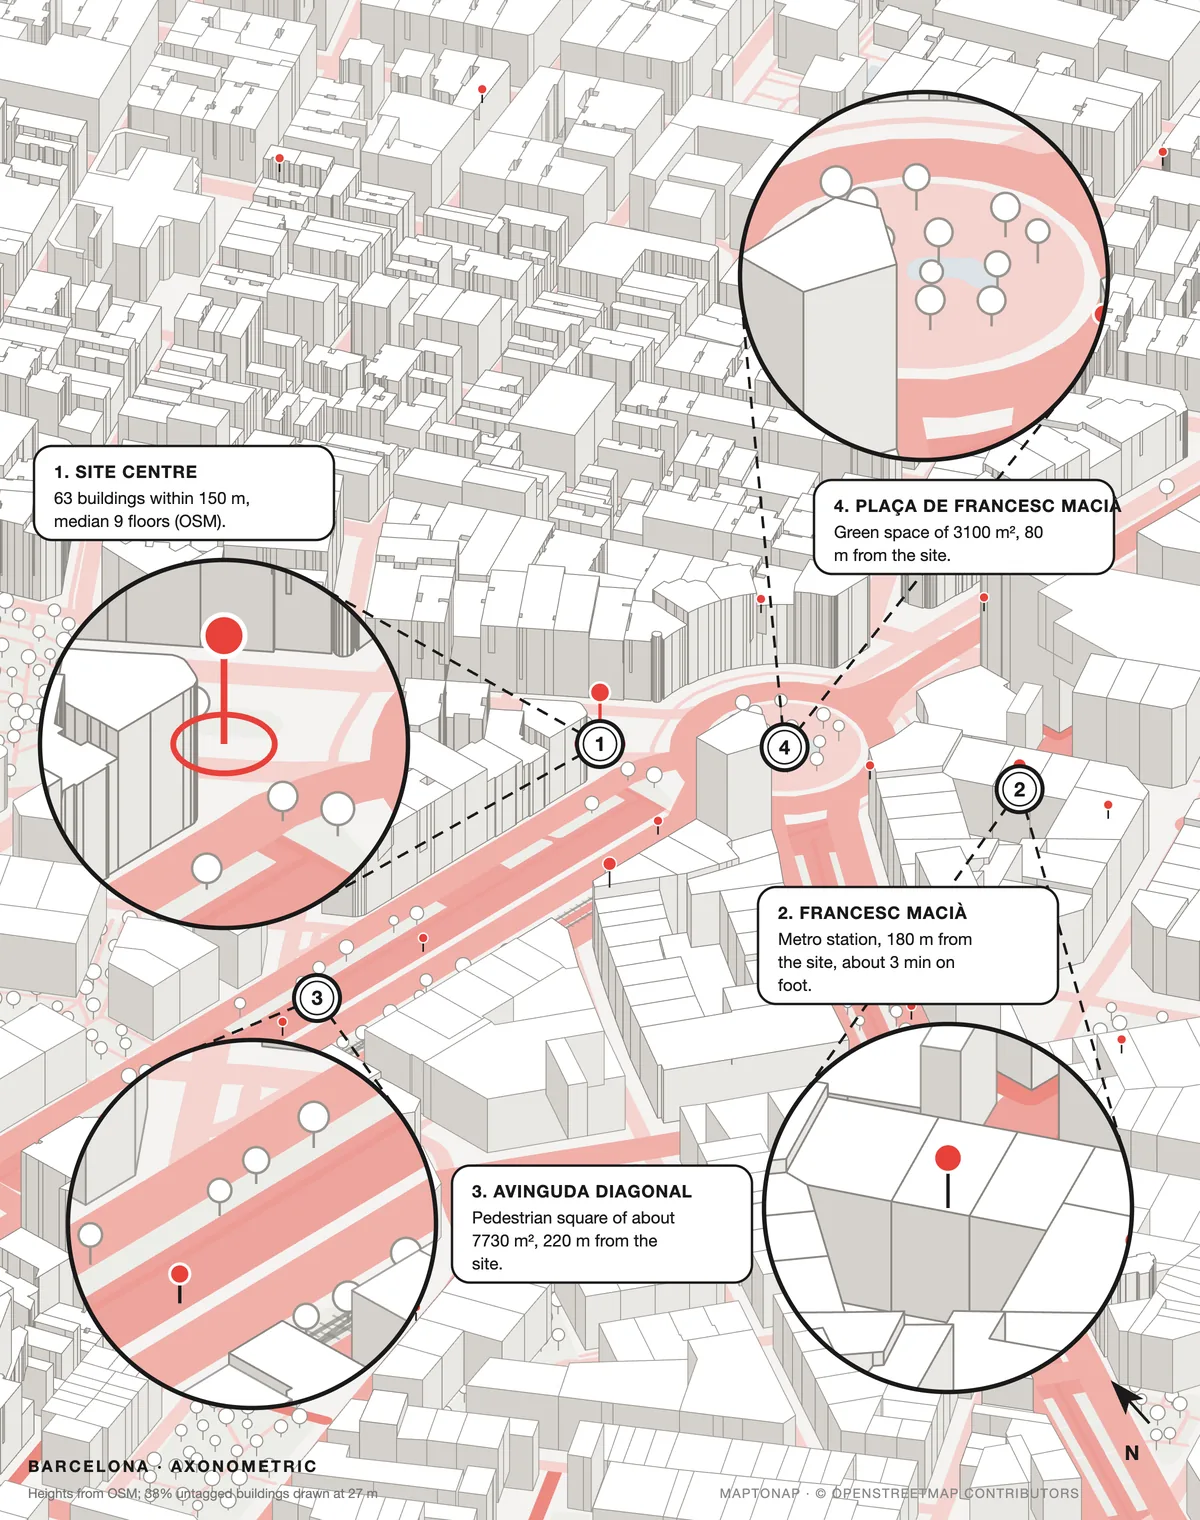
Axonometric callouts (Max)

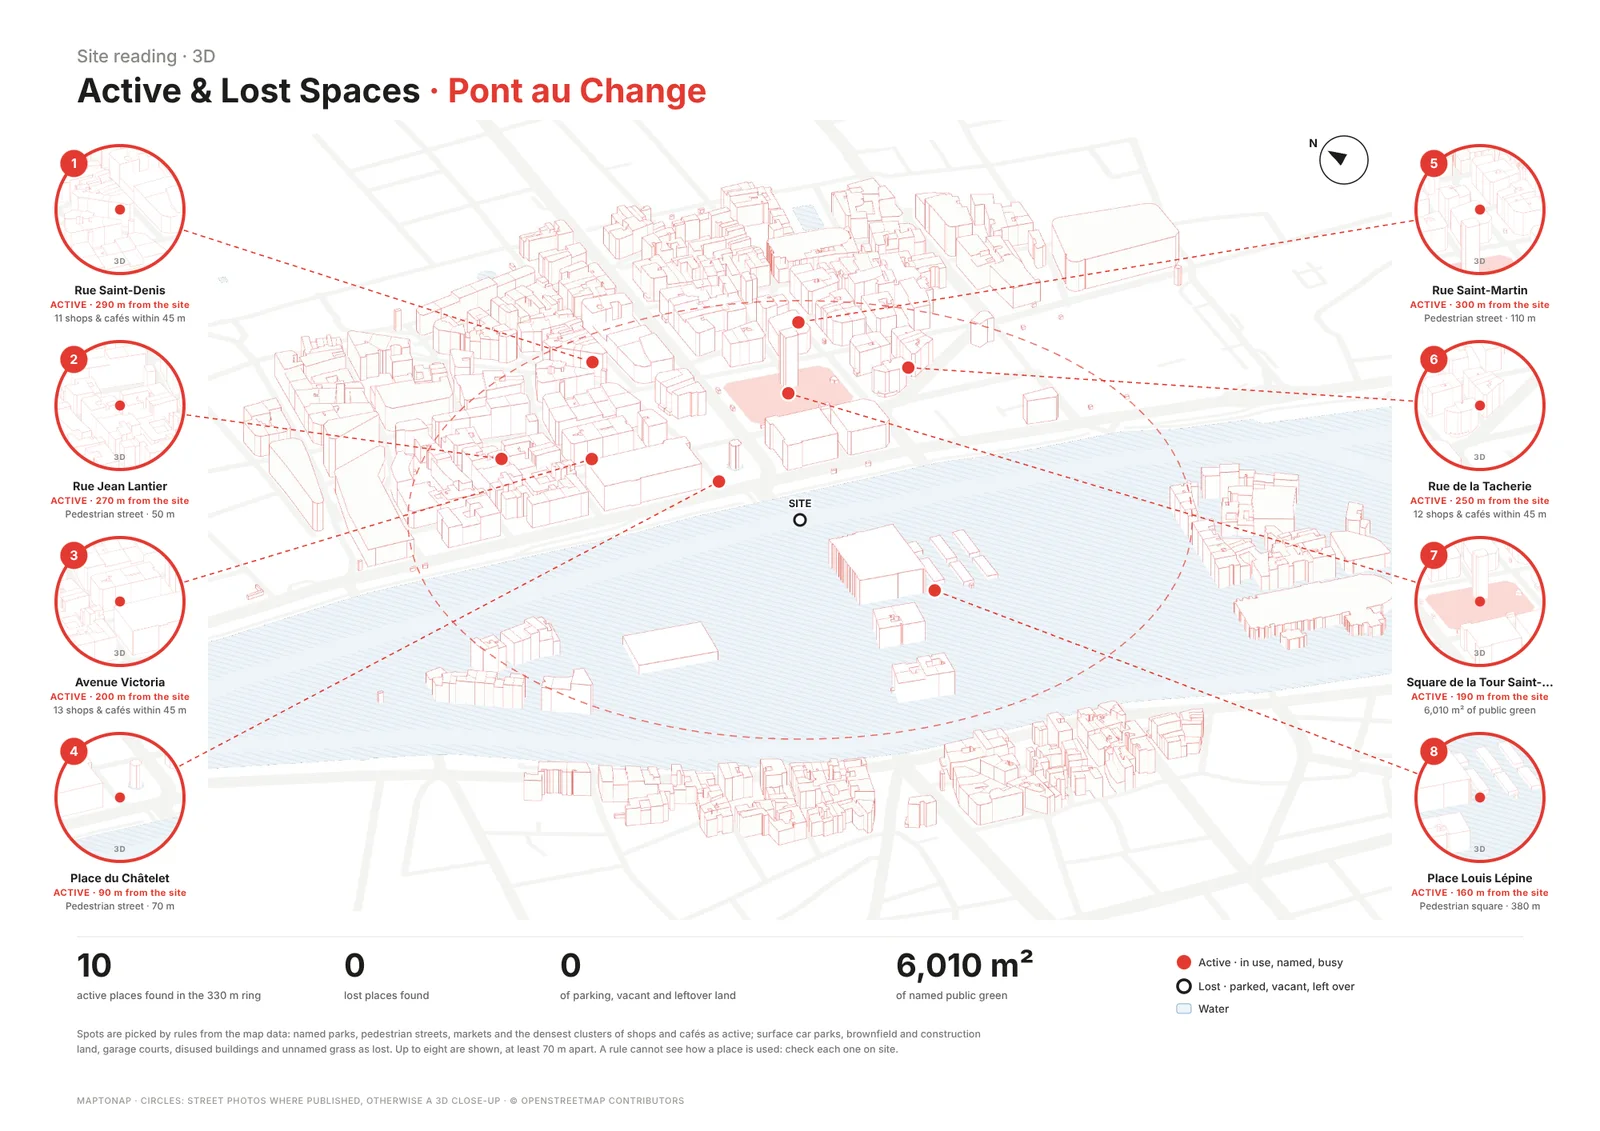
A 3D massing of the site with circular magnified details of the places that matter, ready to annotate.

Sun & wind axonometric (Pro)

Solstice sun paths, the facades they light and the prevailing winds drawn over the 3D context.

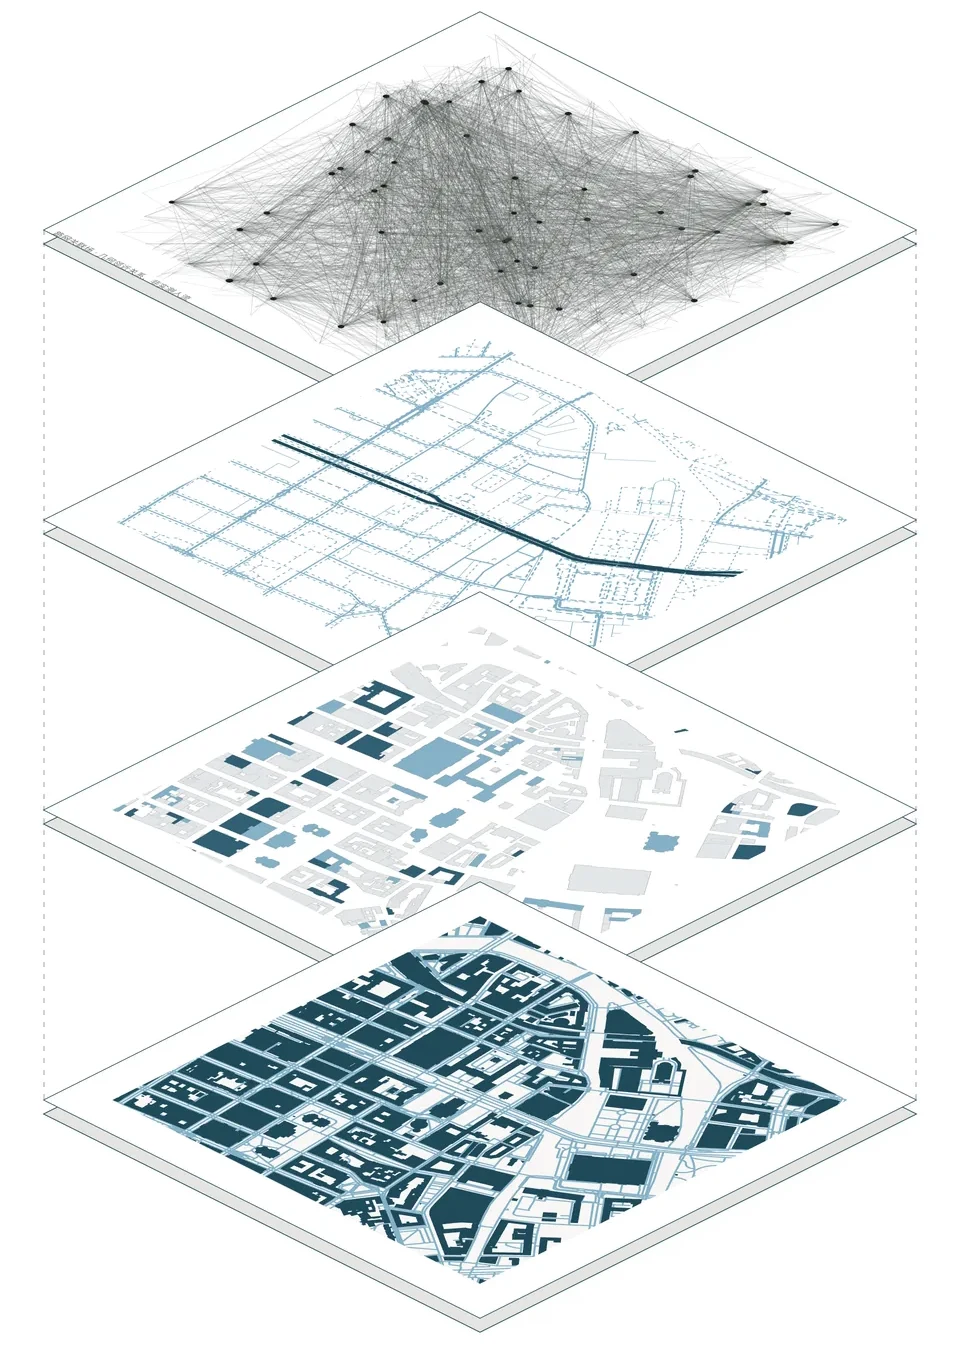
Exploded axonometric (Max)

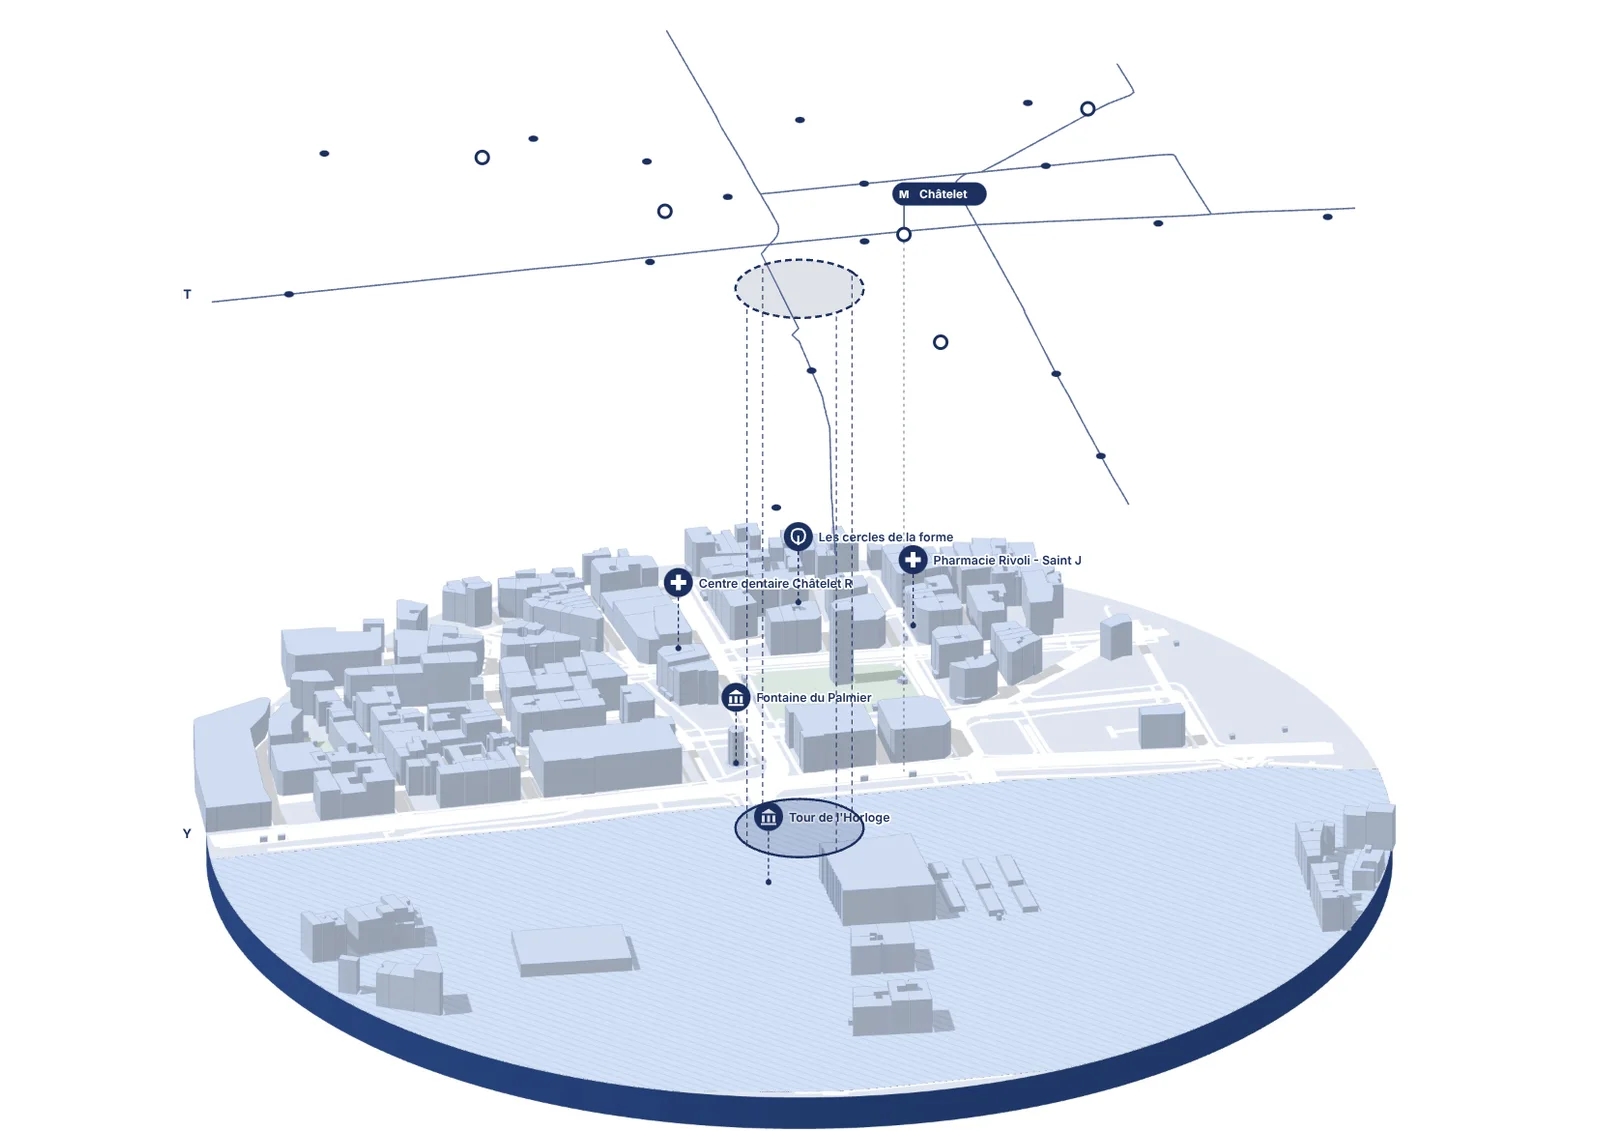
Transit Layers lifts the lines and stops as a floating layer above the city; in 3D Site, Exploded City and Exploded Stack pull terrain, roads, green, land use, density and noise apart into separate levels.

Guide

How to draw an axonometric for site analysis

  1. Pick the projection. An isometric (30°/30°) treats both street directions equally; a plan oblique keeps the plan true and lifts heights vertically, so it can be measured against a site plan. MapToNap uses isometric for massing and plan oblique for line axonometrics.
  2. Use real heights. Heights come from OpenStreetMap height or floor tags; where a building has none, MapToNap uses its floors or a typical value and says so in the legend, instead of inventing a skyline.
  3. Decide what the drawing argues. Colour by floors for density, by use for programme, or keep everything white and mark only the site in red. One message per axonometric reads better than five.
  4. Explode when layers matter. An exploded axonometric separates streets, uses, green and buildings so each layer can be read on its own and compared with the one below. Keep the same frame and scale on every level.
  5. Export as vector. SVG and vector PDF open in Illustrator, Affinity or Inkscape, where you can add labels, change line weights and place the drawing on the board.
Frequently asked questions

Before you start

What is an axonometric diagram in architecture?

An axonometric is a parallel projection that shows plan and height in one drawing without perspective, so dimensions stay measurable. In site analysis it explains the 3D context: building heights, density, open space and how the site sits among its neighbours.

What is an exploded axonometric?

An exploded axonometric pulls a drawing apart into stacked layers, for example terrain, streets, green space, land use and buildings, so each system can be read separately. MapToNap draws exploded stacks in 3D Site (Exploded City and Exploded Stack) and the Transit Layers drawing, which floats the transit network above the city.

Where do the building heights come from?

From OpenStreetMap height and building:levels tags. Where a building has no height, MapToNap estimates it from its floors or a typical value and marks this in the legend; it does not survey buildings.

Can I edit the axonometric?

Yes. Drawings export as editable SVG and vector PDF for Illustrator, Affinity or Inkscape, and as PNG. The 3D Site model also exports to Rhino 3DM, OBJ and GLB (Max).

Is it free?

You can try MapToNap free: four 2D drawings (roads, land use, green and water, urban fabric) and one 3D drawing, with a watermark and no sign-up. Without the watermark and with all 68 analyses there are one-time passes: Pro €7.99 or Max €12.99 for 30 days, or a year of Max for €49. Nothing renews automatically.

Do I need to install anything? Does it work on a phone?

No installation and no setup. MapToNap runs in the browser on any computer, tablet or phone, iPhone or Android: open maptonap.com/app, type an address and press Generate. 3D drawings and simulations run smoothest on a computer.
Related

Keep going