Home / Site analysis / Urban planning & urban design analysis
Urban planning & urban design analysis

Urban analysis diagrams for planning and design

The analyses an urban design or planning studio starts with, drawn for any address in one consistent style: how the city is built, how it moves, what happens where and how well it is connected. All from real OpenStreetMap data, all editable.

Any city with OpenStreetMap dataFabric, movement, uses, accessSpace syntax & 15-minute citySVG · PDF · PNG
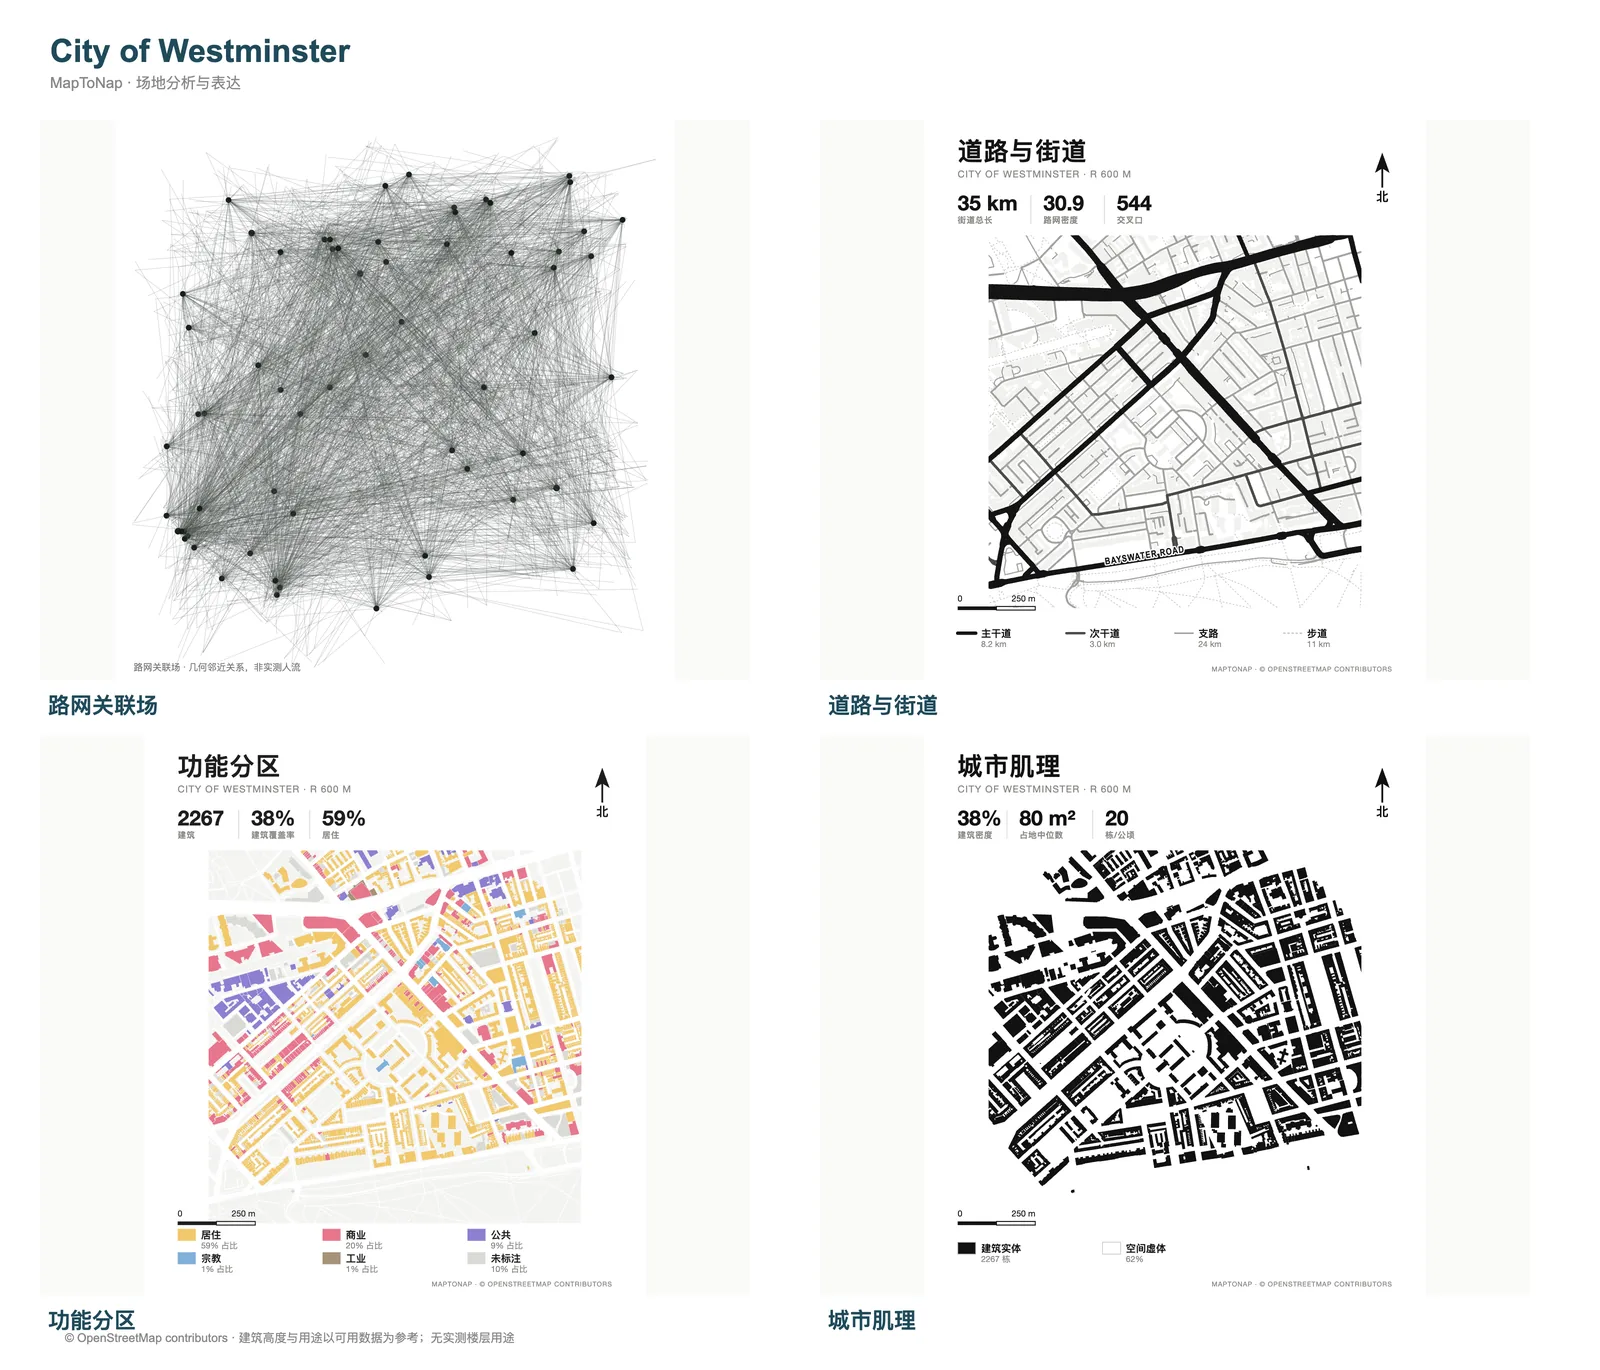
Four-panel urban analysis board of Westminster, London, generated in MapToNap
What you can make

The drawings, and what each one shows

Built form

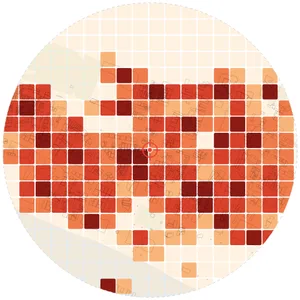
Urban fabric (figure-ground), fabric by footprint size, building density and coverage, building typology catalogue.

Movement

Street network and road hierarchy, pedestrian network, street corridors and what lines them, transit access and walking isochrones.

Uses and activity

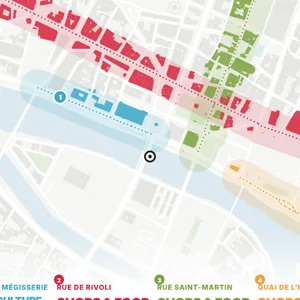
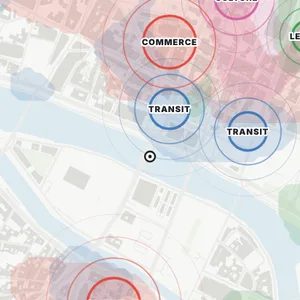
Land use and functional areas, building uses, zoning plans by street block, activity centres and their connections, street vitality.

Connectivity and access

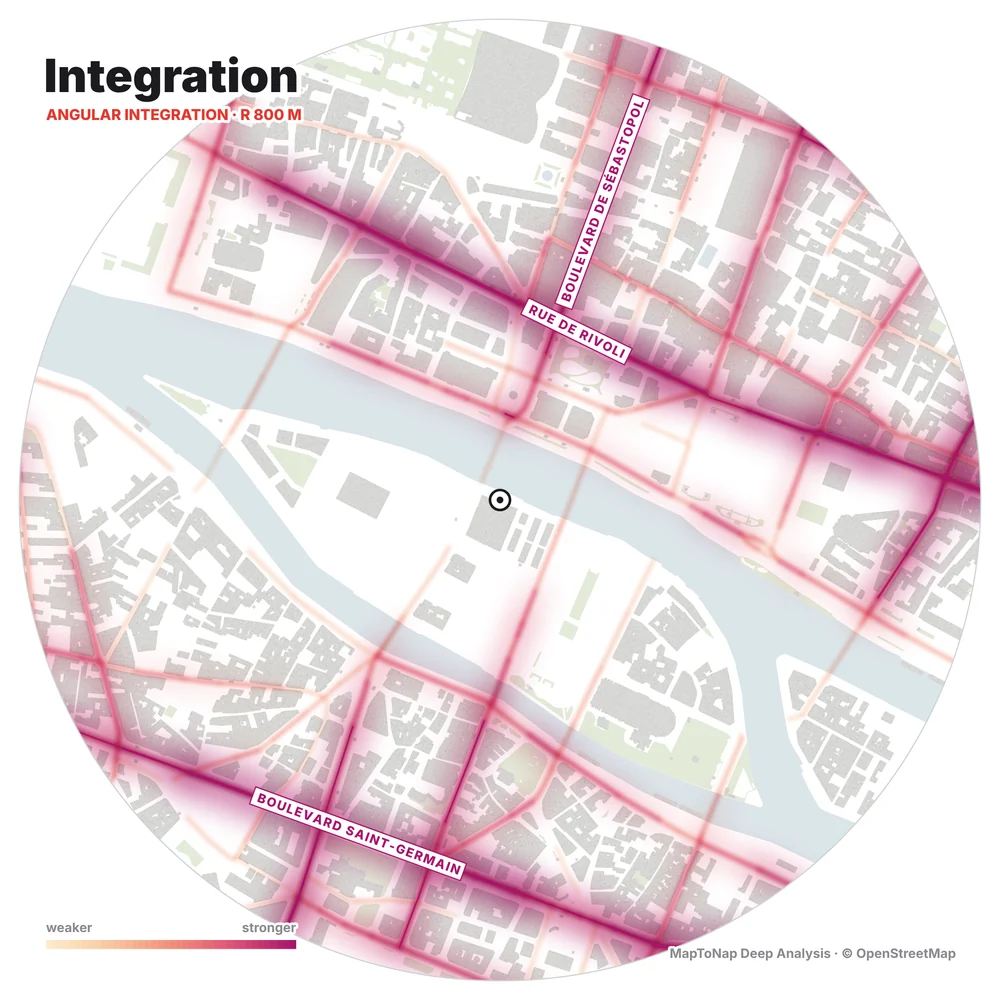
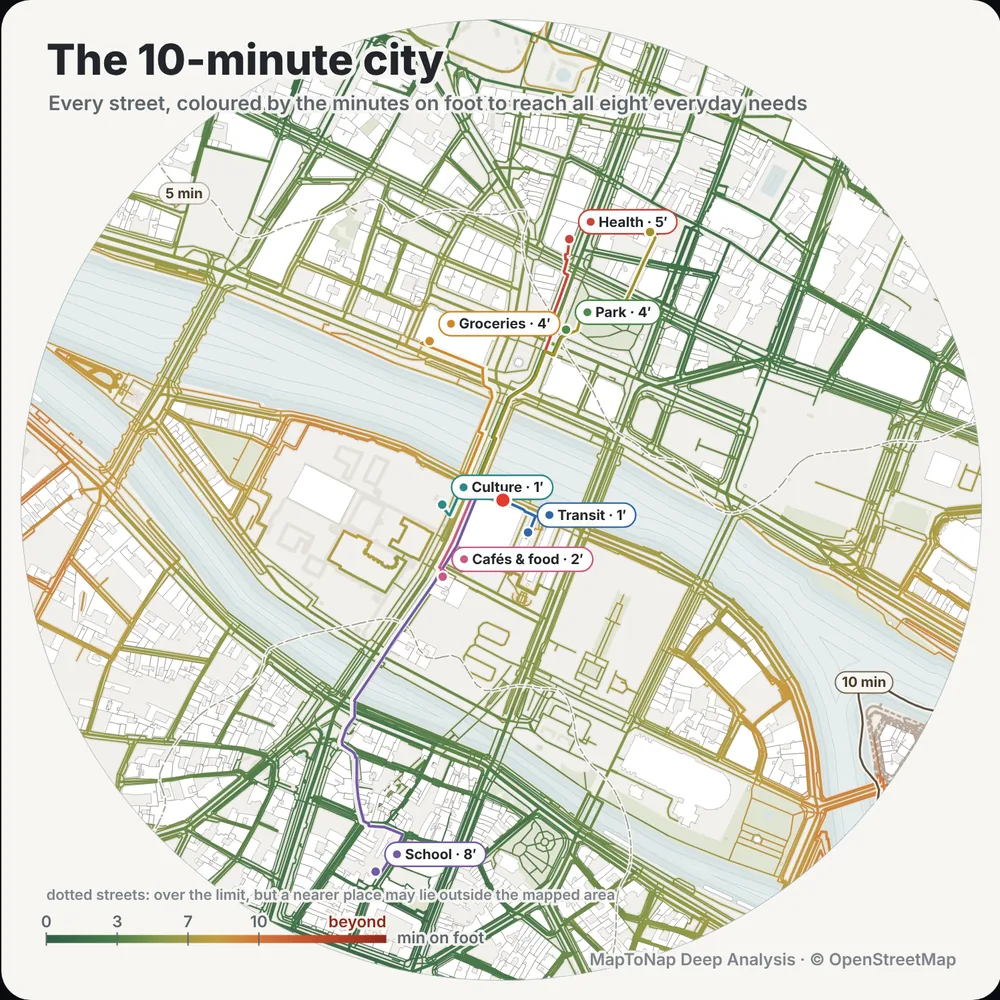
Space syntax integration and choice, 15-minute city, service territories and catchment gaps, isovists and sightlines.

Examples

Straight out of MapToNap

Untouched exports from real sites. Free drawings carry a watermark; Pro and Max drawings are marked.

Map data © OpenStreetMap contributors, available under the Open Database Licence. The images are MapToNap output.

Guide

What an urban analysis should cover

  1. Built form. A figure-ground of the area shows grain, block size and open space. Add density (coverage and floor area) and a typology catalogue to compare blocks.
  2. Movement. The street hierarchy, the pedestrian network and transit stops explain how people arrive. Walking isochrones turn distance into minutes.
  3. Uses. Land use by parcel, building uses and where facilities cluster show what the area is for and where it is mixed. A zoning plan by street block summarises the dominant use of each block.
  4. Connectivity. Space syntax integration shows which streets are most connected to all others, choice shows which carry through-movement; a 15-minute map shows what is within walking distance.
  5. Synthesis. End with opportunities and constraints: what the site can build on and what it must fix. MapToNap draws an opportunities and constraints sheet from the same data.
Frequently asked questions

Before you start

What is urban analysis?

Urban analysis studies how a part of the city is built, used and connected, as the basis for planning or urban design proposals. It usually combines figure-ground, street network, land use, density, transport and public space analyses.

Which cities does it cover?

Any place where OpenStreetMap has data, which includes almost all cities in Europe, the Americas, Turkey, the Middle East and large parts of Asia and Africa. Where a layer has no data, the drawing says so instead of inventing it.

Can I use the diagrams in a planning report or competition?

Yes, commercial use is included in paid plans. Keep the "© OpenStreetMap contributors" credit on map-based drawings, as with any map base.

Is space syntax included?

Yes. Deep Analysis (Max) computes space syntax integration and choice on the real street network in your browser, alongside isovists, walking isochrones and the 15-minute city.

Is it free?

You can try MapToNap free: four 2D drawings (roads, land use, green and water, urban fabric) and one 3D drawing, with a watermark and no sign-up. Without the watermark and with all 68 analyses there are one-time passes: Pro €7.99 or Max €12.99 for 30 days, or a year of Max for €49. Nothing renews automatically.

Do I need to install anything? Does it work on a phone?

No installation and no setup. MapToNap runs in the browser on any computer, tablet or phone, iPhone or Android: open maptonap.com/app, type an address and press Generate. 3D drawings and simulations run smoothest on a computer.
Related

Keep going