Home / All tools / Parametric Lab
Parametric Lab

Parametric diagrams on your real plot

The Parametric Lab turns your programme and your site into geometry that is solved, not drawn: every zone gets its target area on the real plot, the paths grow from the entrance, and the bubble diagram keeps every space in proportion. Change a parameter and the drawing is solved again, with the numbers measured on the result.

Areas solved on the plotFour variantsRuns in the browserSVG · PNG
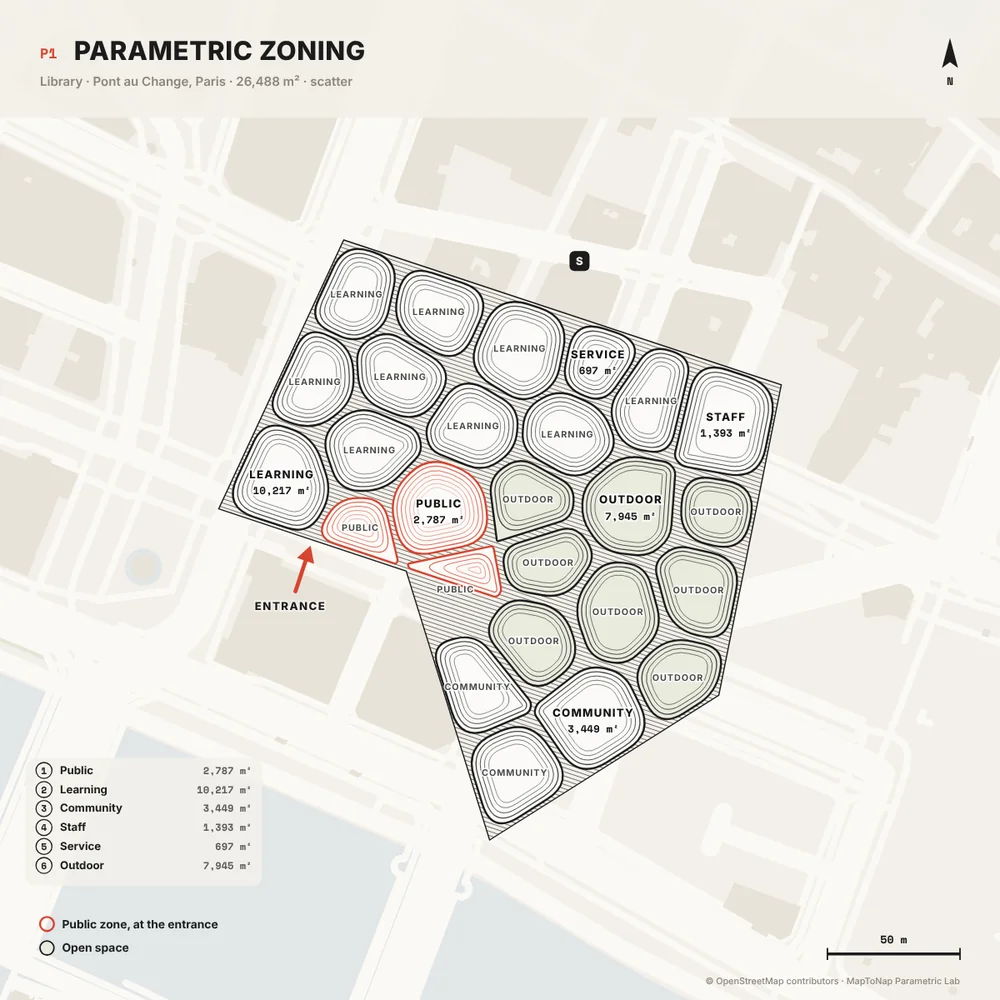
Parametric zoning solved on a real plot in the MapToNap Parametric Lab
What you can make

The drawings, and what each one shows

Parametric zoning (Max)

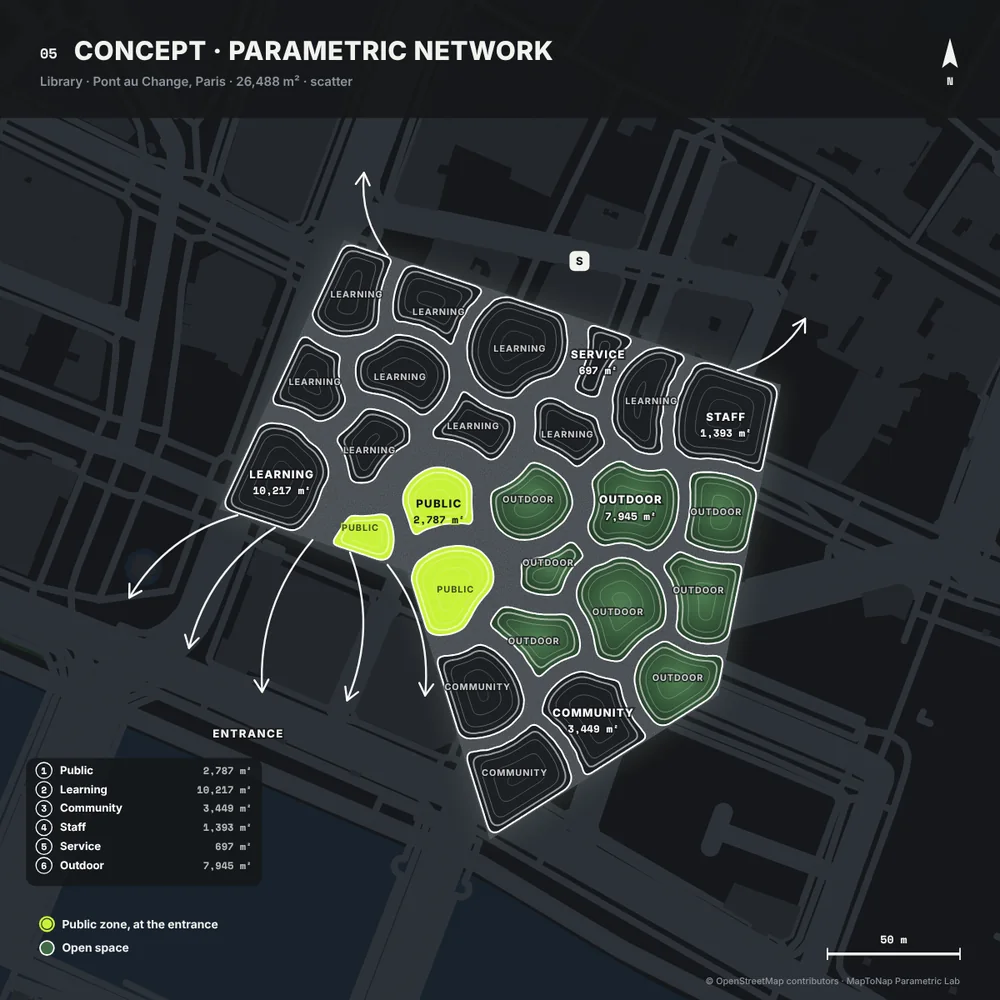
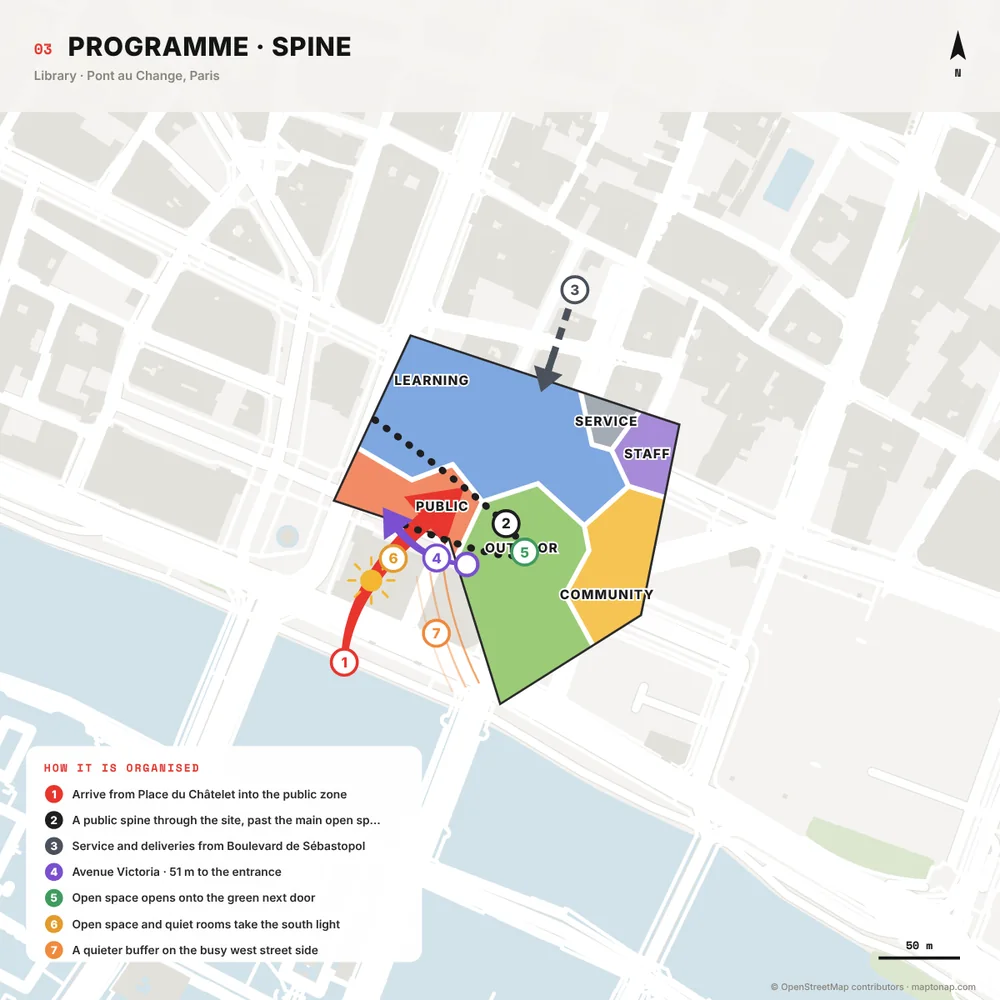
A capacity-constrained power diagram (a weighted Voronoi): every cell belongs to a zone, and the weights are solved until each zone holds its target ground area. Entrance, service, quiet and sunny sides of the site pull their zones toward them.

Parametric network (Max)

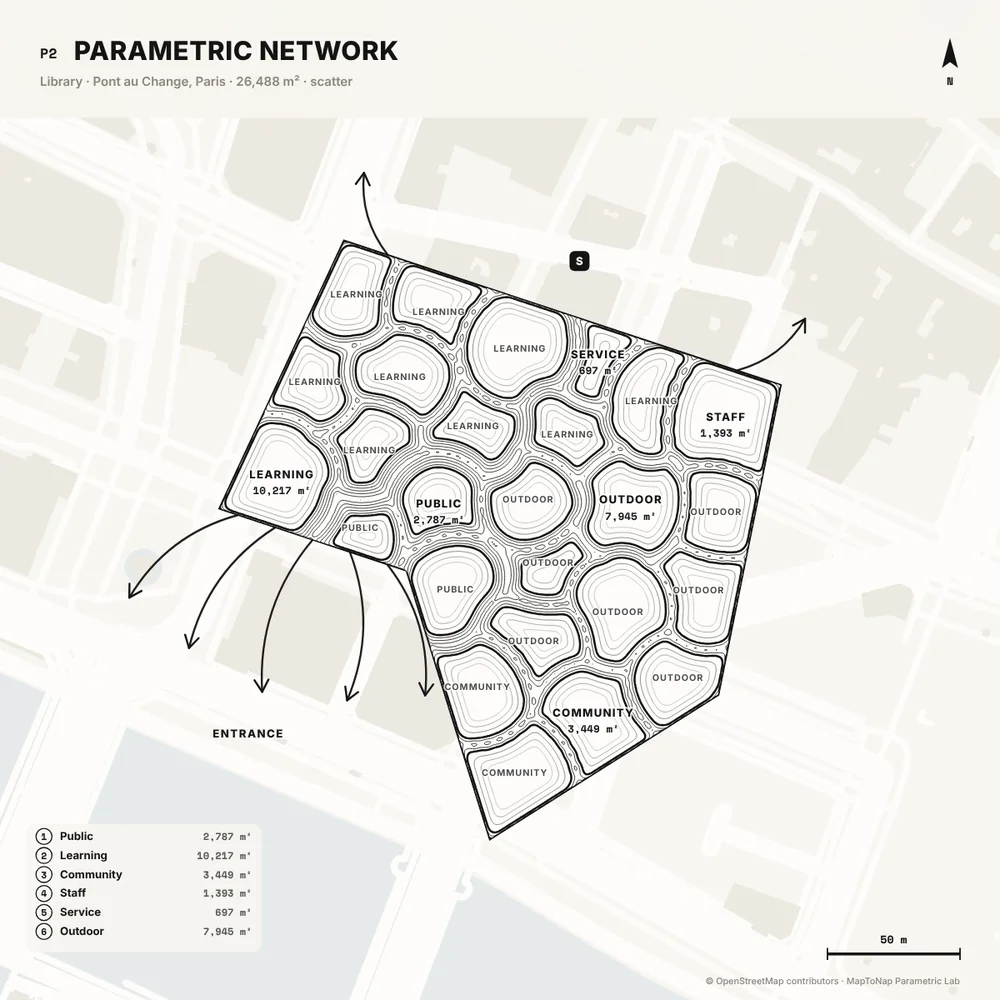
The walls between the zoning cells become a web of branches, wide near the entrance and along the spine, thin between cells of the same zone, joined with soft fillets.

Parametric bubble diagram (Max)

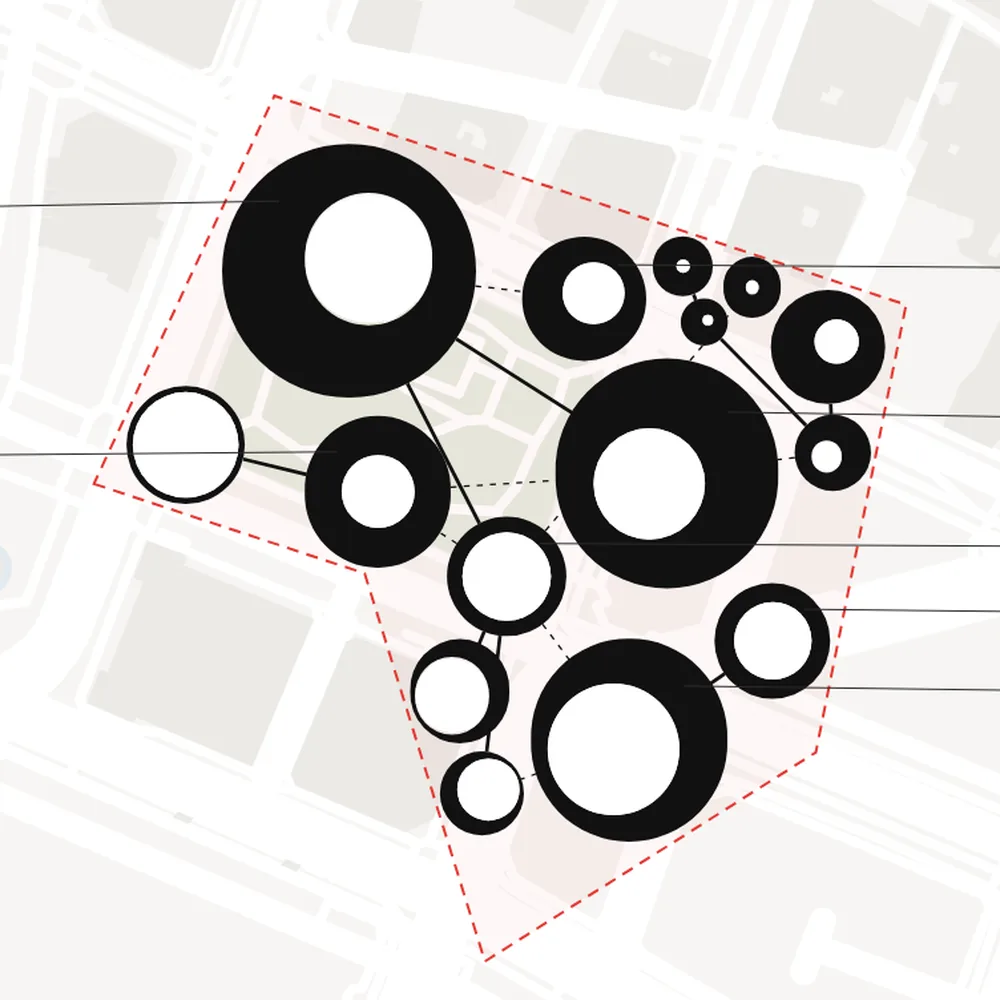
The programme laid out by a force model with exposed parameters: arrangement (central, linear, ring, loose), spacing, hierarchy and link weight. Bubble area stays proportional to floor area.

Three looks and a matrix

Rings with leader labels, white metaballs joined by necks, or donuts whose hole shows how open and daylit each space wants to be, plus a matrix of variants.

Programme for 17 building types

Start from a template sized to your plot, then change the spaces, areas and links: adjacent, near or apart.

Measured, not assumed

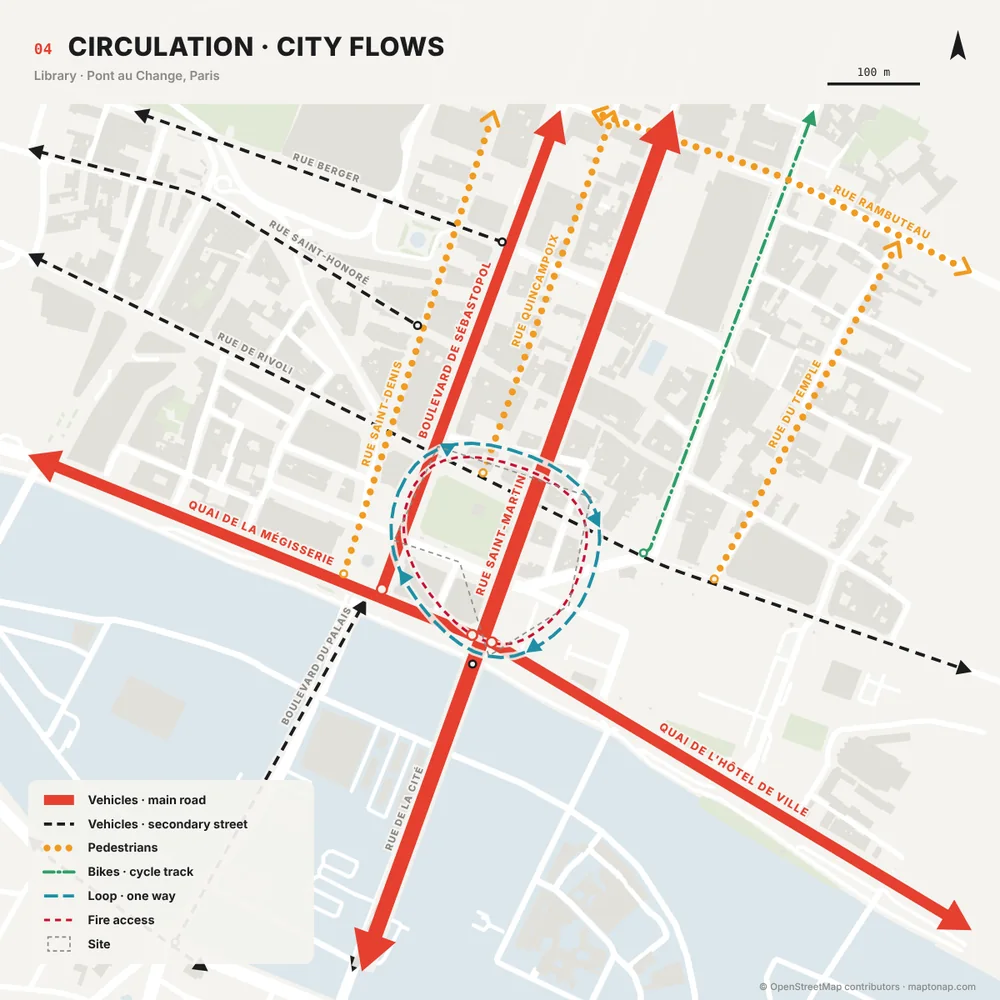
Areas and relations are measured on the solved geometry. Everything is computed from the plot, the programme and the site sides, with no image model and no randomness beyond a seed.

Examples

Straight out of MapToNap

Untouched exports from real sites. Free drawings carry a watermark; Pro and Max drawings are marked.

Map data © OpenStreetMap contributors, available under the Open Database Licence. The images are MapToNap output.

Guide

How to use parametric diagrams in early design

  1. Write the parameters down. Programme spaces with areas, the relations between them (must touch, near, apart) and the site sides that matter: entrance, service, quiet, sun.
  2. Solve, then judge. A solver gives you a layout that meets the numbers; it does not tell you whether it is good. Compare several variants and keep the one whose logic you can explain.
  3. Change one thing at a time. Move the entrance, raise one area or loosen a relation, and see what moves. That is where the diagram teaches you about the brief.
  4. Keep the numbers honest. Report areas measured on the drawing, not the ones you typed in, and say which ones are targets and which are results.
  5. Hand over to design. A parametric diagram is a concept, not a plan. Use it to argue the organisation, then draw the building yourself.
Frequently asked questions

Before you start

What is a parametric diagram in architecture?

A diagram whose geometry is generated from parameters, such as programme areas, adjacencies and site conditions, rather than drawn by hand. Change a parameter and the geometry updates, which makes it easy to compare options in early design.

Do I need Rhino or Grasshopper?

No. The Parametric Lab runs in the browser, inside the MapToNap workspace, on your real plot from the site analysis. Results export as SVG and PNG for Illustrator, Rhino or your board.

Are the zone areas exact?

The zoning solver adjusts its weights until each zone holds its target ground area on the plot, and the areas shown are measured on the result. Treat the programme areas as starting points, not planning figures.

Is it AI?

No. It is a deterministic geometric solver and force model with visible parameters. The same inputs and seed give the same drawing.

Is it free?

You can try MapToNap free: four 2D drawings (roads, land use, green and water, urban fabric) and one 3D drawing, with a watermark and no sign-up. Without the watermark and with all 68 analyses there are one-time passes: Pro €7.99 or Max €12.99 for 30 days, or a year of Max for €49. Nothing renews automatically.

Do I need to install anything? Does it work on a phone?

No installation and no setup. MapToNap runs in the browser on any computer, tablet or phone, iPhone or Android: open maptonap.com/app, type an address and press Generate. 3D drawings and simulations run smoothest on a computer.
Related

Keep going