Home / Site analysis / Urban fabric & morphology
Urban fabric & morphology

Urban fabric analysis: grain, density, typology

How the city around your site is built: the figure-ground of every building, the grain by footprint size, the blocks the buildings form, how densely the ground is covered and which building types repeat. Drawn from real building outlines, in one consistent style.

Every building outlineGrain by footprint sizeDensity & coverageSVG · PDF · PNG
Figure-ground of the Eixample, Barcelona, from OpenStreetMap buildings in MapToNap
What you can make

The drawings, and what each one shows

Figure-ground (free)

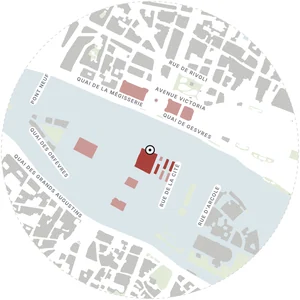
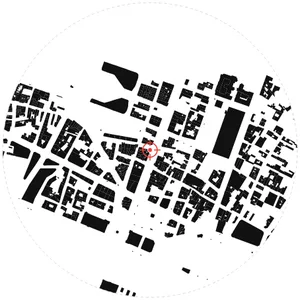
Every building black, everything else white: the basic drawing of urban morphology, with coverage and building count.

Fabric by footprint size (Pro)

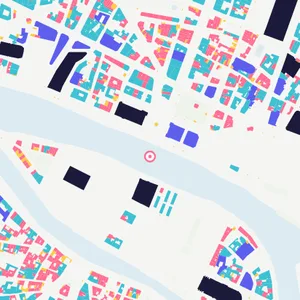
Buildings coloured by footprint area, so fine and coarse grain are visible at a glance.

Generalised fabric (Max)

Buildings merged into blocks with street names placed, for reading the block structure at city scale.

Building density (Pro)

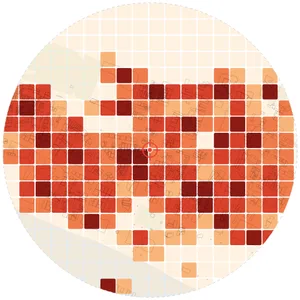
Coverage and floor area per cell of a grid over the site.

Building typology (Pro)

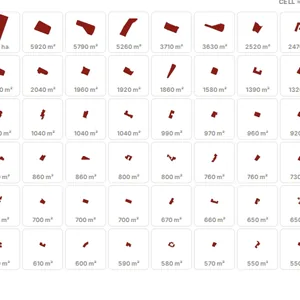
A catalogue of footprints sorted by area, showing which building types make up the area.

Bivariate hex grid (Max)

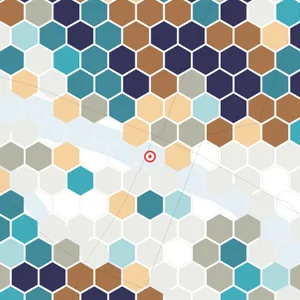
Building coverage against amenities per hexagon, to see where dense also means lively.

Examples

Straight out of MapToNap

Untouched exports from real sites. Free drawings carry a watermark; Pro and Max drawings are marked.

Map data © OpenStreetMap contributors, available under the Open Database Licence. The images are MapToNap output.

Guide

How to read and draw an urban fabric analysis

  1. Start with the figure-ground. Black buildings on white ground show grain, block size and the shape of public space. Keep the same scale for every area you compare.
  2. Measure the grain. Colour buildings by footprint area: historic centres show many small footprints, later districts fewer large ones.
  3. Read the blocks. Merging buildings into blocks shows the street pattern behind them: grid, radial, organic or a mix.
  4. Quantify density. Building coverage and floor area per grid cell turn the impression into numbers you can compare with your proposal.
  5. Catalogue the types. A typology catalogue sorted by footprint makes the repeated building types visible, which helps decide what the new building should continue or contrast.
Frequently asked questions

Before you start

What is urban fabric analysis?

Urban fabric analysis studies the physical structure of a part of the city: the pattern of buildings and open spaces, block sizes, grain and density. It is a core part of urban morphology and of the site analysis for an architecture project.

What is the difference between figure-ground and urban fabric?

The figure-ground is the basic drawing, buildings in black and open space in white. Urban fabric analysis builds on it with grain, block structure, density and building types.

How accurate are the building outlines?

They are OpenStreetMap building footprints, which are very complete in most European and many other cities. They are not a cadastral survey; where outlines are missing, the drawing shows the gap rather than inventing buildings.

Is it free?

You can try MapToNap free: four 2D drawings (roads, land use, green and water, urban fabric) and one 3D drawing, with a watermark and no sign-up. Without the watermark and with all 68 analyses there are one-time passes: Pro €7.99 or Max €12.99 for 30 days, or a year of Max for €49. Nothing renews automatically.

Do I need to install anything? Does it work on a phone?

No installation and no setup. MapToNap runs in the browser on any computer, tablet or phone, iPhone or Android: open maptonap.com/app, type an address and press Generate. 3D drawings and simulations run smoothest on a computer.

Related

Keep going