Product
Browser-based site analysis and diagram toolkit for architecture, urban design and landscape
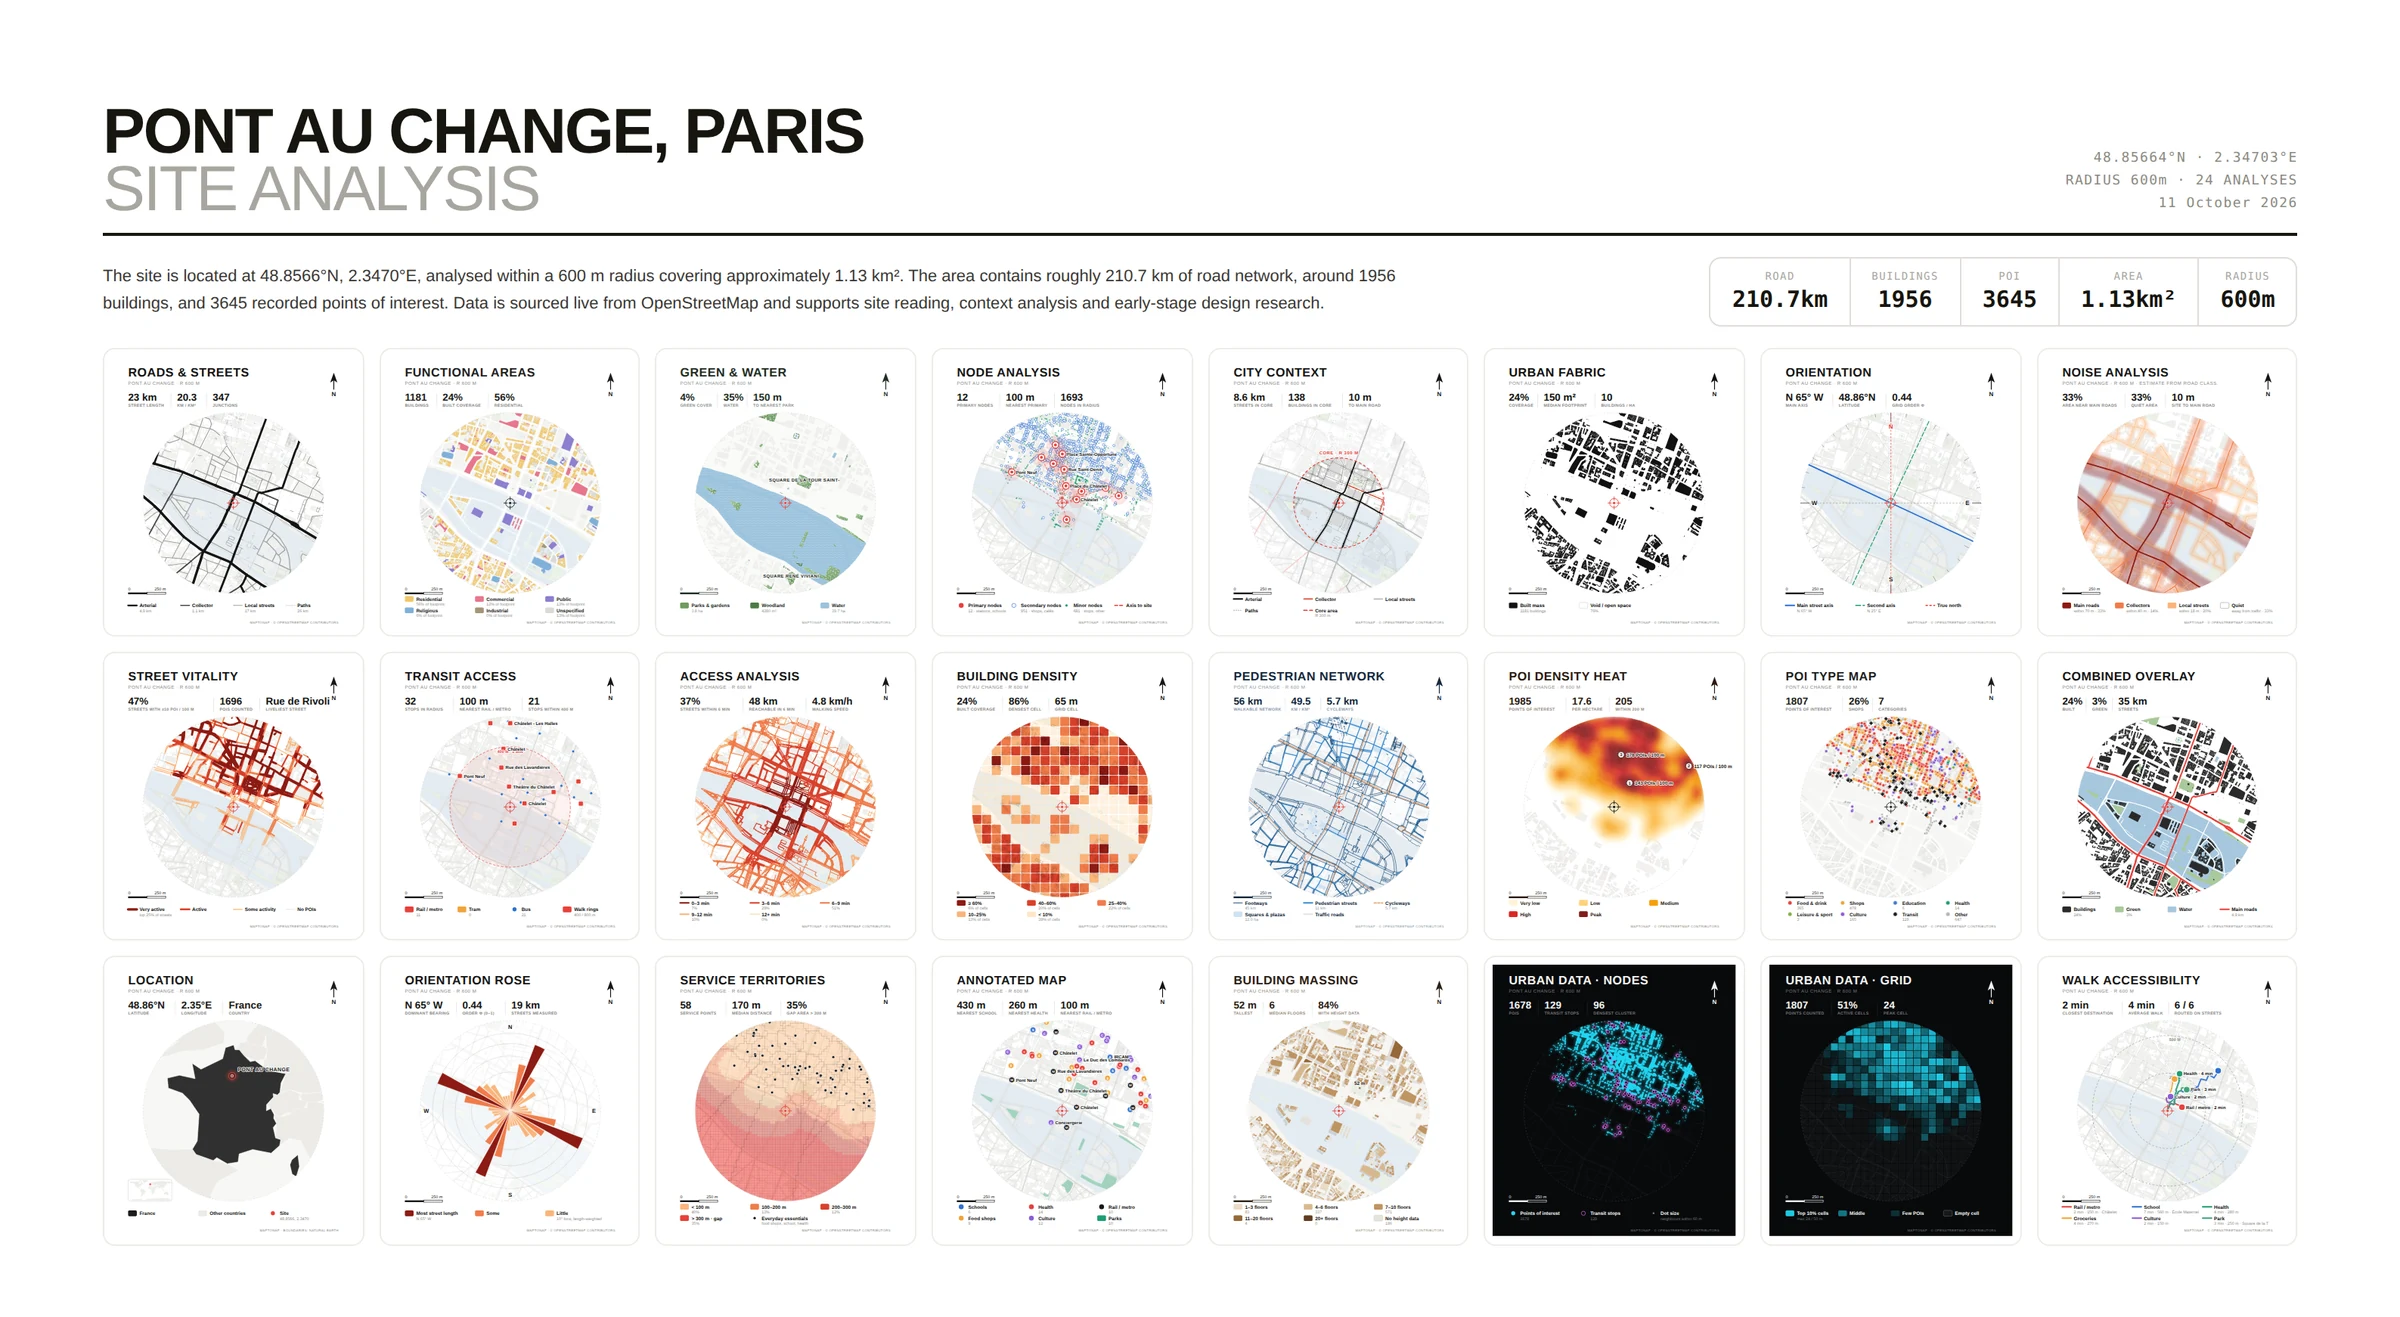
MapToNap is a browser-based site analysis toolkit for architects and architecture students. Drop a pin on any address and it draws up to 47 site analysis diagrams from real open data as editable vectors, and builds a 3D site model you can export to Rhino 3DM, OBJ or GLB. It does not use AI image generation.
Browser-based site analysis and diagram toolkit for architecture, urban design and landscape
An independent developer and architecture student in Milan, Italy (formerly EasyMap, easymap.uk)
Architecture and urban design students, architects, planners and landscape designers
47 site analysis diagrams (one is a visual analysis with real street photos), a 3D site model, six Deep Analysis studies, and concept, strategy, flow, bubble, plan and elevation drawings
PNG, editable SVG, vector PDF, A3 report; 3D: Rhino 3DM, OBJ, GLB; floor plans: DXF
OpenStreetMap; NASA POWER climate; Terrain Tiles elevation (SRTM, USGS, EU-DEM); Mapillary street-level photos (CC BY-SA 4.0) for the visual analysis
None. Drawings come from data and editable geometry
Free: 4 analyses with watermark · Pro €7.99 / 30 days · Max €12.99 / 30 days · Max 1 year €49. One-time payments, no subscription
Any modern browser on desktop or tablet; no install, no account
Website: English, Spanish, Chinese. App: English, Chinese
Six studies in Max: 24 hours of real sun and shadow, walking isochrones, isovists and VGA, design impact on sun, views and walking, the 15-minute city and hour-by-hour footfall. Free to try on the Paris sample
Worldwide, wherever OpenStreetMap has data
Roads & streets, urban fabric (figure-ground), land use, building density, building typology, location, city context, orientation, annotated map, context mapping board, and a visual analysis board with numbered view cones and real street photos
Pedestrian network, walk accessibility, transit access, access analysis, street vitality, node analysis, service territories, POI density and POI type maps
Green & water, sun path & wind, wind flow, noise and sound sources, annual temperature, precipitation, daylight hours, solar radiation, annual climate
Topography, slope & drainage, terrain wireframe, building massing, isometric massing, and a full 3D site model with buildings, terrain, roads, water and trees
Max also opens eight design tools in the same workspace: site concept, site strategy, flow diagrams, bubble diagrams, concept lab, floor plan / axonometric, plan render and elevation / section.
Deep Analysis (Max) goes past diagrams with six studies computed in the browser: a day in the site (real sun, shadows and open hours, with a map of sun hours), walk pulse (walking isochrones on the real streets), sightlines (isovists and visibility graph analysis), design impact (draw blocks and see the sun, views and walks they take from the neighbours), the 15-minute city (minutes on foot to eight daily needs on every street) and footfall (an hour-by-hour estimate of people on each street). Try it on the Paris sample.
MapToNap is a browser-based site analysis and diagram toolkit for architecture students, architects and urban planners. You choose a site on a map and it draws up to 47 site analysis diagrams from real open data as editable vectors, and builds a 3D site model you can export to Rhino 3DM, OBJ or GLB.
Partly. Four analyses (roads, land use, green and water, figure-ground) are free with a watermark and no sign-up. Pro costs €7.99 for a 30-day pass and Max €12.99 for a 30-day pass or €49 for a full year. Passes are one-time payments and never renew automatically.
No. Every drawing is built from map data, open climate and elevation data and rule-based, editable geometry. Nothing is generated by an image model, so the drawing matches the real site.
Buildings, streets, land use, water and points of interest come from OpenStreetMap. Climate data (sun, wind, temperature, rainfall, solar radiation) comes from NASA POWER. Elevation comes from Terrain Tiles on AWS Open Data (SRTM, USGS, EU-DEM). Street-level photos in the visual analysis come from Mapillary (CC BY-SA 4.0).
CAD export tools such as CADMAPPER give you raw linework of an area to draw over in CAD. MapToNap draws finished analysis diagrams (land use, sun path, noise, transit access and more) in one graphic style, ready for a presentation board, and also exports a 3D site model. Many students use both.
No. MapToNap runs in a modern web browser on desktop or tablet. Projects are saved in your browser; an account is not needed. Paid licences are restored with a licence code.
Any place with OpenStreetMap data, which covers the whole world, including Latin America, Europe, Turkey, the Middle East and Asia. The level of detail depends on how well the area is mapped.
Yes. Paid plans include commercial use for your own projects, clients and publications. Keep the "© OpenStreetMap contributors" attribution on map-based drawings.
Yes. The Visual Analysis board (Max) draws numbered view cones on the plan and fills each with a real street-level photo from Mapillary, taken where the site can really be seen past the buildings in front, with the site picked out in red. The photos are CC BY-SA 4.0 and every photographer is credited on the board.
Six studies of the site that go beyond diagrams: 24 hours of real sun and shadow, walking isochrones, isovists and visibility graph analysis (VGA), the impact of a proposed design on sun, views and walking, the 15-minute city and an hour-by-hour footfall model. It runs in your browser on real map data, is part of Max and is free to try on the Paris sample.