Home / Site analysis / Population analysis
Population analysis

Population analysis for architecture

Who lives around your site, drawn in the same graphic language as the rest of the board: where the residents are, building by building, how many are women and men, children, young people and older people, and how the country's population changed since 1960. Estimates from open population data, compared with the five kilometres around and with the country.

About 30 m population gridAge and sexCountry since 1960SVG · PDF · PNG
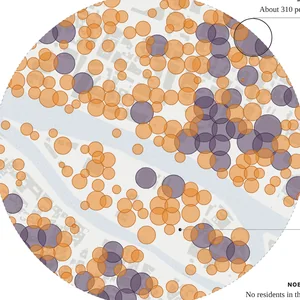
Population density around a site: estimated residents drawn as proportional circles on the buildings, generated in MapToNap
What you can make

The drawings, and what each one shows

Population density (Pro)

The estimated residents placed on the mapped buildings and drawn as proportional circles: purple where it is denser than the five kilometres around, orange where it is sparser. With the people per km² by distance from the site and the largest patch where nobody lives.

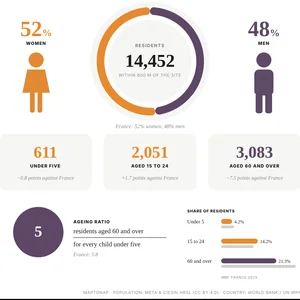
Population composition (Pro)

Women and men, children under five, people aged 15 to 24 and people aged 60 and over within the radius, each compared with the country, and the ageing ratio: residents over 60 for every child under five.

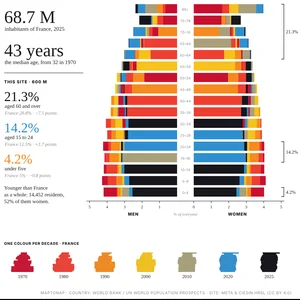
Population pyramid (Pro)

The country by age and sex in five-year bands, one colour per decade since 1960, with the median age then and now, and the site's older, young and youngest residents set against it.

Examples

Straight out of MapToNap

Untouched exports from a real site in central Paris.

Population: Meta & CIESIN High Resolution Settlement Layer, available under CC BY 4.0. Country figures: World Bank, from UN World Population Prospects, CC BY 4.0. Map data © OpenStreetMap contributors, available under the Open Database Licence. The images are MapToNap output.

Guide

How to read population data for a design

  1. Start with how many people live there. How many residents live within the radius, and how dense that is against the five kilometres around, tells you whether the site sits in a quiet edge or a crowded core. It sets the scale of everything else: the shops, schools and open space the place can carry.
  2. Look at where they live. The density drawing places the estimated residents on the mapped buildings. Clusters show where homes are; empty patches show offices, rail land, parks or water. A new public space or entrance belongs where people already are, or where you want to bring them.
  3. Read who they are. Age and sex change what a place needs: many children under five call for play and nurseries, many young people for study and night life, many residents over 60 for benches, shade, step-free routes and health care. The composition drawing compares each group with the country.
  4. Put the site in the country\'s story. The population pyramid shows how the country changed since 1960, decade by decade, and where the site's own groups sit against it. A site older or younger than its country is a reason to say so in the brief.
  5. Remember they are estimates. The population data model where people live from census counts and satellite imagery; MapToNap spreads each 30 m cell over the buildings in it. Use the drawings for the story and the order of magnitude, and the census for exact figures.
Frequently asked questions

Before you start

Where does the population data come from?

From the High Resolution Settlement Layer by Meta and the Center for International Earth Science Information Network (CIESIN), which estimates residents on a grid of about 30 metres from census counts and satellite imagery, by sex and for children under five, people aged 15 to 24 and people aged 60 and over. The country pyramid comes from the World Bank, which publishes the UN World Population Prospects by age and sex. Both are open data under the Creative Commons Attribution 4.0 licence, and the drawings credit them.

How exact are the numbers for my site?

They are estimates. The population map spreads census counts over the settled area it detects, so a small area can be off, especially where buildings changed recently. MapToNap then shares each cell's residents over the buildings in it by floor area, with homes first. The drawings say they are estimates; for exact figures use the national census.

Does it work everywhere?

Where the population map has coverage, which is most of the world. Where it has none, the drawing says so instead of guessing. The country pyramid needs the country in the World Bank data.

Is it free?

You can try MapToNap free: four 2D drawings (roads, land use, green and water, urban fabric) and one 3D drawing, with a watermark and no sign-up. Without the watermark and with all 92 analyses there are one-time passes: Pro €7.99 or Max €12.99 for 30 days, or a year of Max for €49. Nothing renews automatically.

Do I need to install anything? Does it work on a phone?

No installation and no setup. MapToNap runs in the browser on any computer, tablet or phone, iPhone or Android: open maptonap.com/app, type an address and press Generate. 3D drawings and simulations run smoothest on a computer.
Related

Keep going