One click · 47 drawings · 0% AI

The whole site,
already drawn.

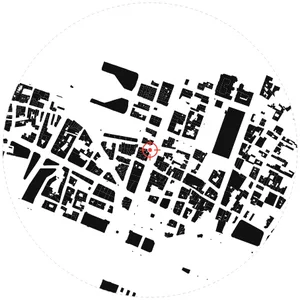
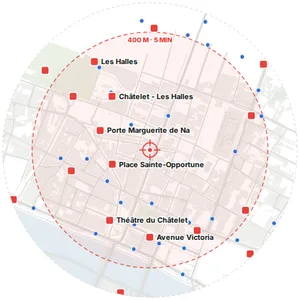
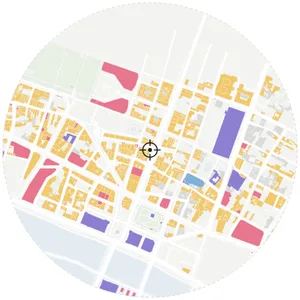
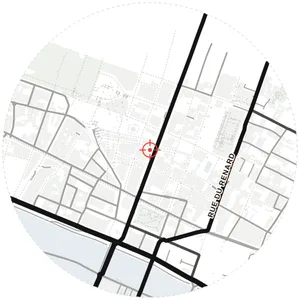
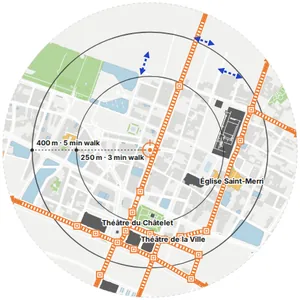
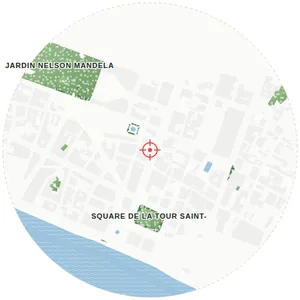
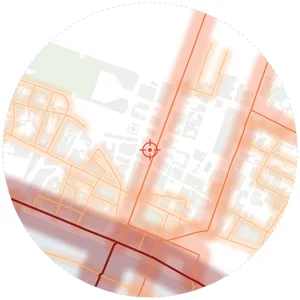
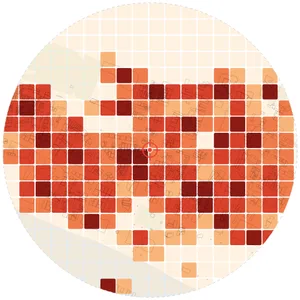
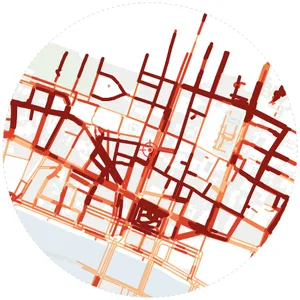
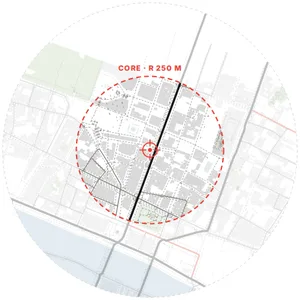
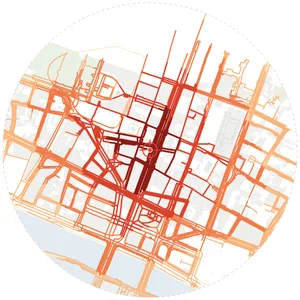
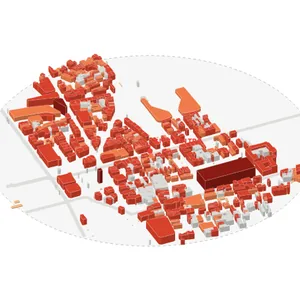
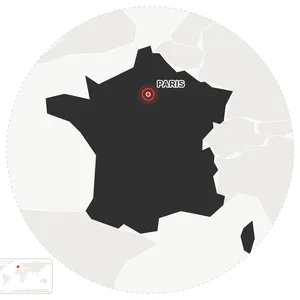
Drop a pin, press Generate once: 47 site analyses and a 3D model, drawn from real map data. The weekend of tracing is gone.

4 drawings free · no sign-up
One address

Every layer
of the site.

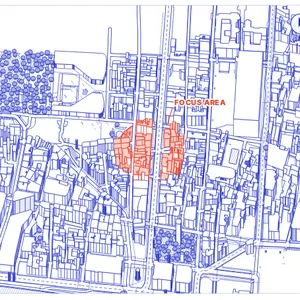
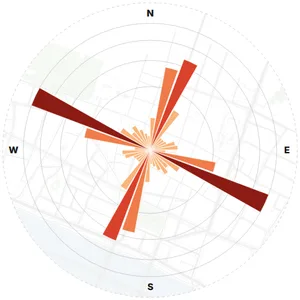
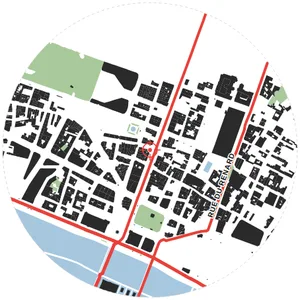
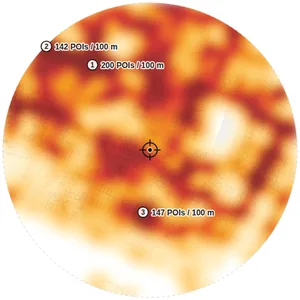
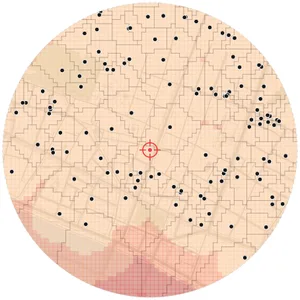
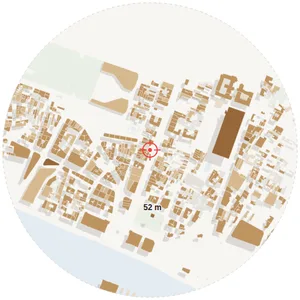
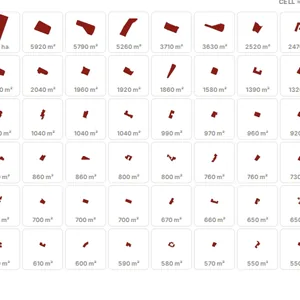
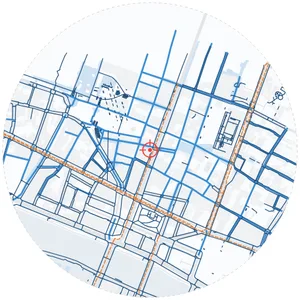
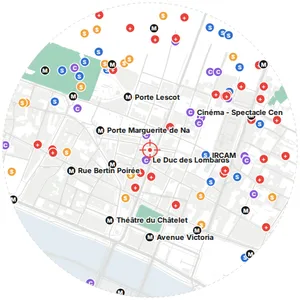
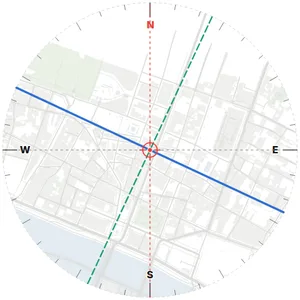
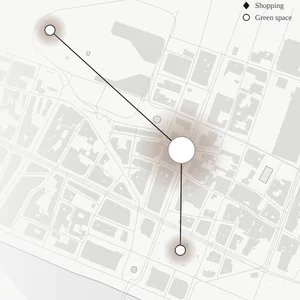
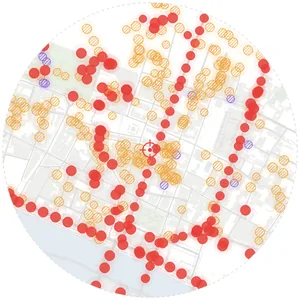
Streets, land use, green and water, noise, urban fabric and massing: six layers from one click, each a separate editable drawing on the same point.

Scroll ↓
NEWDeep AnalysisMAX

Read a site
like no one else.

Six studies that no other site tool runs, built on real map data and computed in your browser. Not pictures of a site: the site itself, measured hour by hour, step by step, sightline by sightline.

A day in the site: MapToNap Deep Analysis
A day in the site18:20 · PARIS
Walk pulse: MapToNap Deep Analysis
Walk pulse10 MIN · PARIS
Sightlines · VGA: MapToNap Deep Analysis
Sightlines · VGAPARIS
Design impact: MapToNap Deep Analysis
Design impact2 BLOCKS · MAR 20
15-minute city: MapToNap Deep Analysis
15-minute city10 MIN · PARIS
Footfall: MapToNap Deep Analysis
Footfall18:00 · WEEKDAY
  • 01
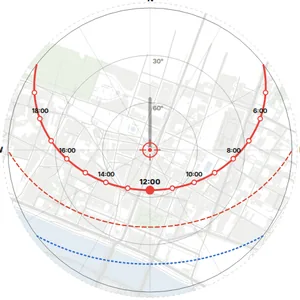
    A day in the site24 hours of real sun, shadows, open shops and transit, from golden hour to blue hour, plus a map of the hours of sun on every square metre. Export a 20-second film.
  • 02
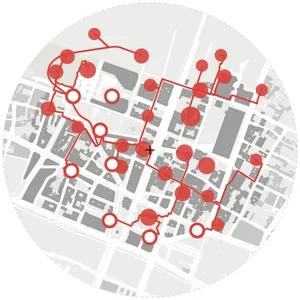
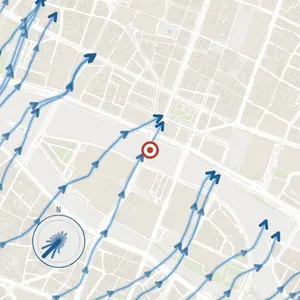
    Walk pulseYour walk is drawn along the real streets at walking pace, with minute contours (isochrones). Shops and stations are marked the minute you would reach them.
  • 03
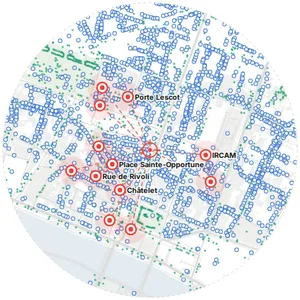
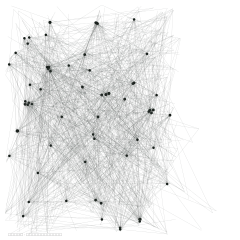
    SightlinesDrag a point and see exactly what is visible from it, facade by facade. One click maps visibility across the whole site (VGA).
  • 04
    Design impactDraw one or more blocks, as rectangles or free shapes, set their floors, and see what they do to the neighbours: hours of sun lost on the ground and facades, views from the street, walking detours.
  • 05
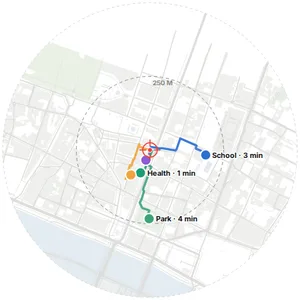
    15-minute cityEvery street coloured by the minutes on foot to eight everyday needs: groceries, health, school, park, transit, cafés, culture, sport. Tap a point to see its walk to each.
  • 06
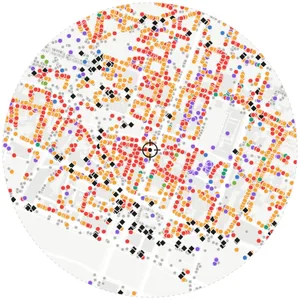
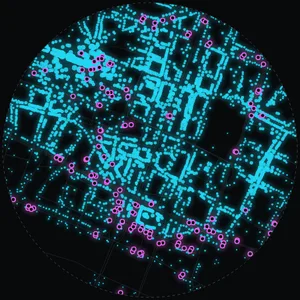
    FootfallAn hour-by-hour estimate of the people on each street, from homes, stations and the places open at that hour, with walkers moving along their routes. Find the frontage for an entrance.
Try it on Paris, free →Included in MaxAll six studies are free on the Paris sample. Your own sites need Max.
01One click

One click.
The whole set.

Pick the site, tick what you need, press Generate once. Every analysis comes out in one style, at one scale, ready to export. The part of a studio project that used to eat a weekend is now a button.

  • Screenshot the map, trace every block
  • Colour the land use plot by plot
  • Draw the sun path from a chart
  • Restyle twenty diagrams until they match
02Drawn, not generated
0%generated.

No prompts, no image models, no guessing. MapToNap reads real survey and climate data and draws it as editable geometry.

  • Buildings
    Every footprint is a real buildingMapped outlines and heights, not shapes an image model imagined.
  • Climate
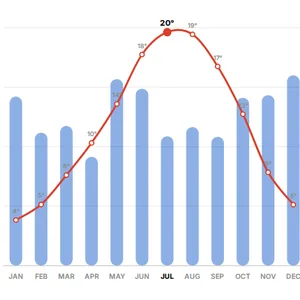
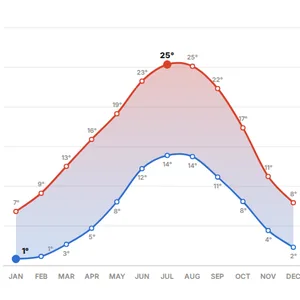
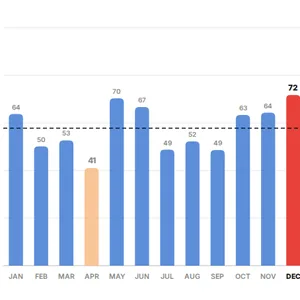
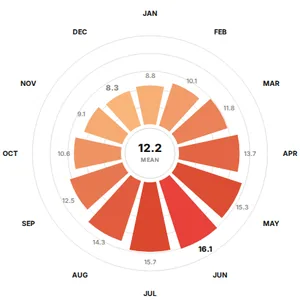
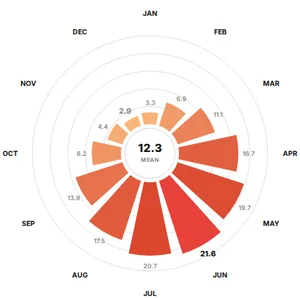
    Sun, wind and rain for your coordinatesYears of recorded weather, drawn as charts you can defend in a review.
  • Terrain
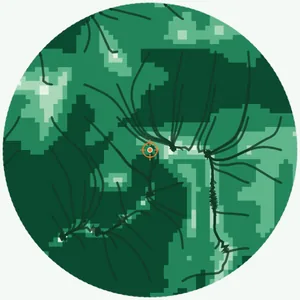
    Contours from measured elevationSlopes, drainage and the 3D ground of your site.
  • Gaps
    Missing data stays missingIf something is not mapped, the drawing says so instead of inventing it.
Pin→Real data→Editable geometry→Your drawing
03New this month

Sheets you can
pin up tonight.

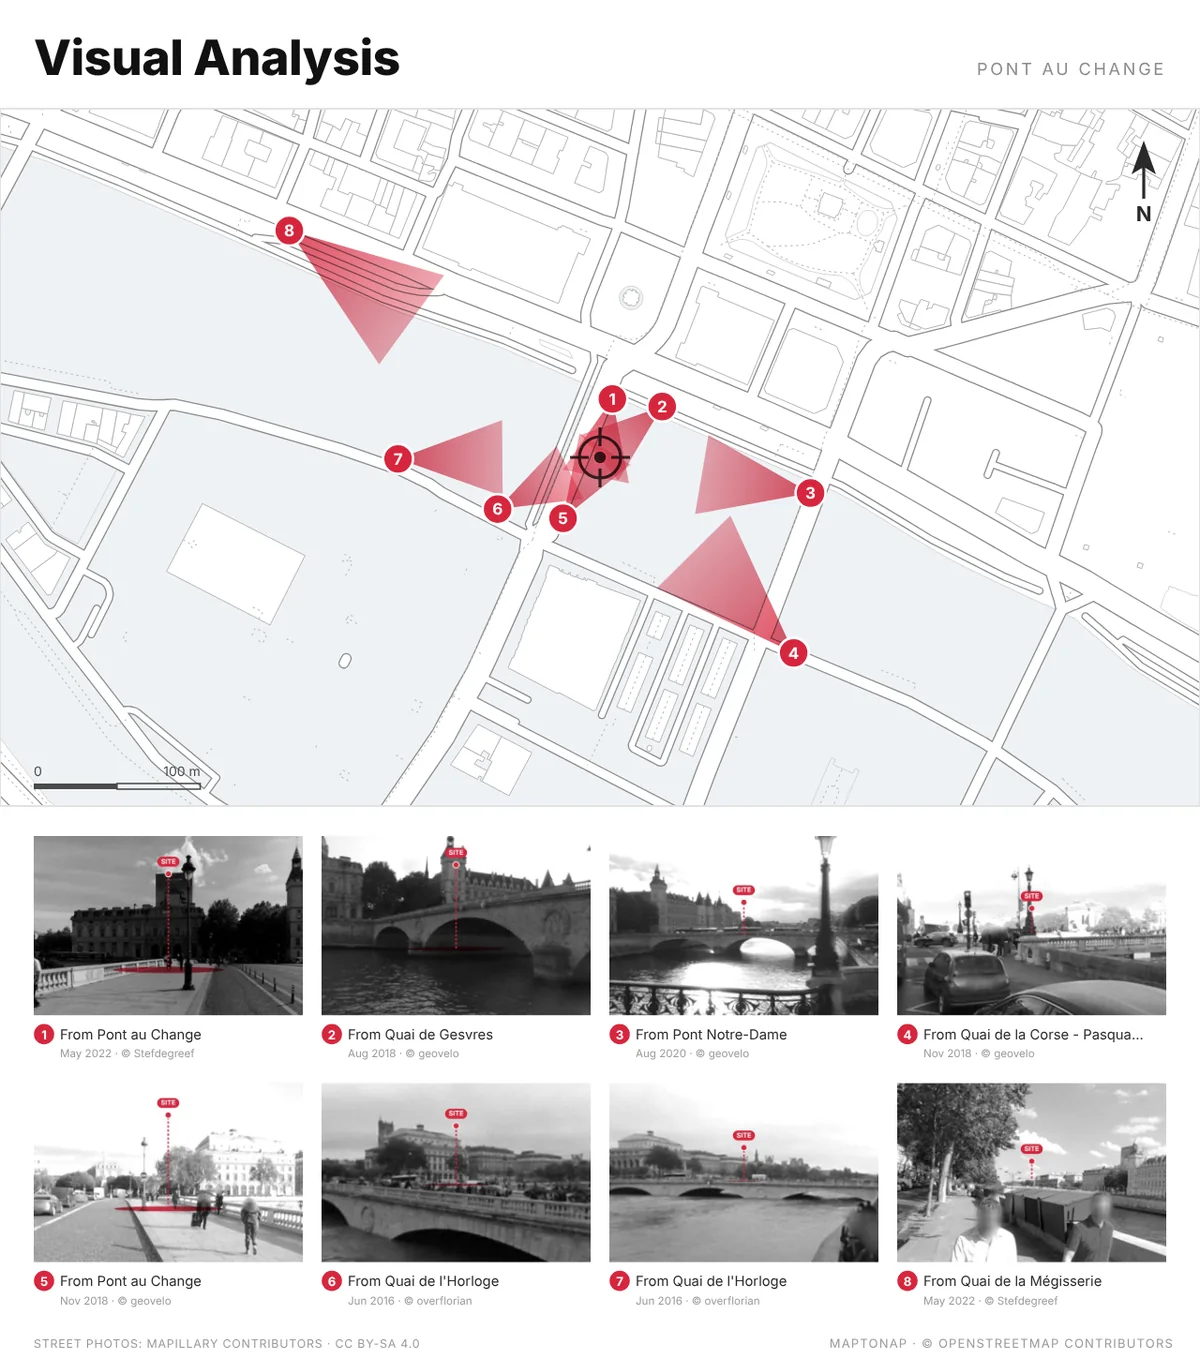
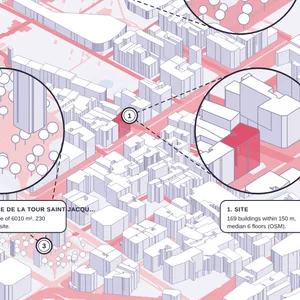
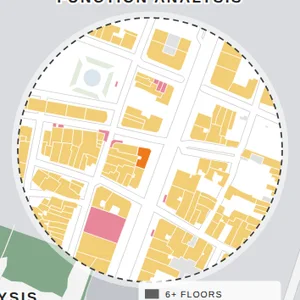
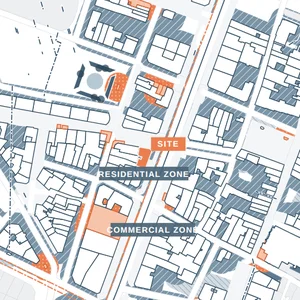
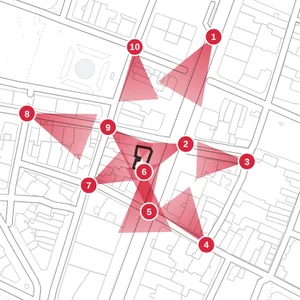
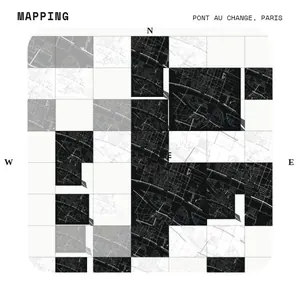
Every drawing here is an untouched export from MapToNap: Barcelona, Paris and Milan, straight out of the app. Titles, legends, scale bars and north arrows included. New: the Visual Analysis now finds real street photos of the site by itself.

Axonometric Callouts, Barcelona: real MapToNap export
Axonometric CalloutsBarcelona
Site Inset Board, Paris: real MapToNap export
Site Inset BoardParis
Transit Access, Milan · 2 km: real MapToNap export
Transit AccessMilan · 2 km
Zoning Plan, Barcelona: real MapToNap export
Zoning PlanBarcelona
Line Axonometric, Paris: real MapToNap export
Line AxonometricParis
Visual Analysis with real street photos, Paris: real MapToNap export
Visual AnalysisParis · street photos
POI Type Map, Milan: real MapToNap export
POI Type MapMilan
04Compose

Boards that
lay themselves out.

Tick the drawings, pick a format. MapToNap sets them on the sheet with one grid, one type scale and one legend style.

Four-up board of the City of Westminster: links, streets, land use and urban fabric
Four-up board · City of Westminster
Exploded layer board of Berlin
Exploded layers · Berlin
Site axonometric analysis with real building heights
Site axonometric · real heights
A3 reportall analyses A2 · hero + sixportrait A3 · one large + fourlandscape 16:9 · triptychfor slides Nine-gridsquare
06Tool guide

What each tool
is for.

Eleven tools on one site. Start with the one-click analysis, finish on the board. Point at a tool to see what it does.

01 2D · FREE · PRO · MAX

47 analyses in one click.

Drop a pin, tick what you need, press Generate once. Figure-ground, streets, land use, green and water, transit, walking distance, noise, sun and wind, climate, terrain and the presentation boards, all from real map data and in one style.

PNG · SVG · PDF · A3 / A2 / 16:9
Open Site analysis →
02 3D · MAX

A site model, ready for Rhino.

The same pin builds the context in 3D: buildings with real or estimated heights, terrain, streets, water, green and trees. Turn it in the browser, then export.

Rhino 3DM · OBJ · GLB
Open 3D site →
03 DEEP ANALYSIS · MAX

Six studies no other tool runs.

Watch your site through a day of real sun and shadow, walk its streets minute by minute, see what is visible from any point, test a design against its neighbours, check the 15-minute city and read the footfall hour by hour.

MP4 · PNG · SVG
Open Deep Analysis →
04 CONCEPT · MAX

Zones and programme on the site.

Draw functional zones, paths and soft organic islands right over the site to show where the programme goes. Every shape stays editable.

PNG
Open Site concept →
05 STRATEGY · MAX

Your design moves, explained.

Where people enter, how they move, what is protected, what connects and where the focus is: arrows, axes and nodes over the site that turn decisions into a clear story.

Open Site strategy →
06 FLOW · MAX

How people move through it.

Pedestrian, vehicle, service and landscape routes with hierarchy and direction, without redrawing arrows and line styles every time.

PNG · SVG
Open Flow diagrams →
07 PROGRAMME · MAX

Programme and adjacency.

Turn a list of spaces into bubbles, link the ones that belong together and drag them until the plan logic is clear, before you draw a single wall.

Open Bubble diagrams →
08 IDEA · MAX

The first idea, as a diagram.

Fields, gradients and layered acrylic-style shapes for abstract concept studies: the image that opens a concept board.

PNG · SVG
Open Concept lab →
09 PLAN · AXO · MAX

Plans that become axonometrics.

Build levels, walls, floors and objects, then turn the same project into axonometric views. The one tool here that exports DXF for CAD.

PNG · SVG · DXF
Open Floor plan / axo →
10 RENDER · MAX

Colour a plan for the board.

Import linework or a PNG, keep the transparent areas and build a controlled palette, so the plan reads clean on the board.

Open Plan render →
11 RENDER · MAX

From line drawing to board.

Add materials, ground, sky, atmosphere and entourage to an elevation or section while the drawing stays legible.

PNG · SVG · PDF
Open Elevation / section →

07Passes

A pass for the project,
not a subscription.

Thirty days cover a studio deadline. Nothing renews by itself, and we remind you three days before a pass ends.

Invite code applied: 20% off at checkout.
Free · 4 drawings, watermarked, no sign-upStart free
Pro pass

Pro

30 days
  • 36 analyses, no watermark
  • Editable SVG, vector PDF, A3 report
  • Colour themes and custom legends
€7.99once
Max pass

Max

30 days · most chosen
  • All 47 analyses + 3D model
  • Rhino 3DM · OBJ · GLB export
  • Presentation boards
  • All nine design tools
  • Deep Analysis · 6 studies
€12.99once
1 year

Max, a full year

365 days · best value
  • Everything in Max for 12 months
  • Every tool added during the year
  • Less than four 30-day passes
  • +7 days for each friend you invite
€49once

Invite a classmate

They save 20% on any pass; you get 7 more days for each friend who buys.

Your code appears after a purchase
See passes
Secure checkout by Stripe. Commercial use included.Studio or school? Talk to us
08Good to know

No prompts.
All control.

Is this an AI image generator?

No. Every drawing is built from maps, open data and editable geometry, so you can change the composition, colours and relationships yourself. The 3D model at the top of this page is made the same way.

What happens after 30 days?

The pass ends by itself. Nothing is charged again, and we email you three days before. Your projects stay in your browser and the four free analyses keep working. Buy another pass, or a full year of Max, whenever you need it.

I bought before passes existed. Do I lose anything?

No. Every purchase made before 30-day passes stays permanent, exactly as you bought it.

Can I use the drawings commercially?

Yes. Every paid plan includes commercial use for your own projects, clients and publications. Keep the OpenStreetMap attribution on map-based drawings.

Studio or school licences and invoices?

Write to [email protected] with the number of seats and your billing details. We reply with a quote and an invoice.

What can I export?

Site-analysis outputs include PNG, editable SVG and vector PDF, plus an A3 report. Floorplan also exports DXF. 3D Site exports Rhino 3DM, OBJ and GLB.

Where is my work saved?

In this browser. Export a project backup before clearing browser data or moving to another device; your purchase restores anywhere with your code.

Can I download a 3D site model?

Yes. With MAX, 3D Site exports Rhino 3DM, OBJ or GLB. Up to 1 km² includes 3 exports per 24 hours; supported selections from 1–4 km² cost €2 per export.

Do I need to install anything?

No. MapToNap runs in any modern browser. A laptop gives you the most room for drawing and editing.
Can the visual analysis use real street photos?

Yes. The Visual Analysis board (Max) draws numbered view cones on the plan and fills each with a real street-level photo from Mapillary, taken where the site can really be seen past the buildings in front, with the site picked out in red. The photos are CC BY-SA 4.0 and every photographer is credited on the board.

What is Deep Analysis?

Six studies of the site that go beyond diagrams: 24 hours of real sun and shadow, walking isochrones, isovists and visibility graph analysis (VGA), the impact of a proposed design on sun, views and walking, the 15-minute city and an hour-by-hour footfall model. It runs in your browser on real map data, is part of Max and is free to try on the Paris sample.

From map
to nap.

47 drawings and one A3 board before midnight. Then close the laptop.