 MapToNapDeepAnalysis
Deep Analysis reads a site the way a design studio would, from the real streets, buildings and places in OpenStreetMap, computed in your browser: sun and shadow, walking, sightlines, the impact of a new design, the 15-minute city, footfall and space syntax. It uses rules and geometry, not AI. It is part of MapToNap Max, and you can try every study on the Paris sample.
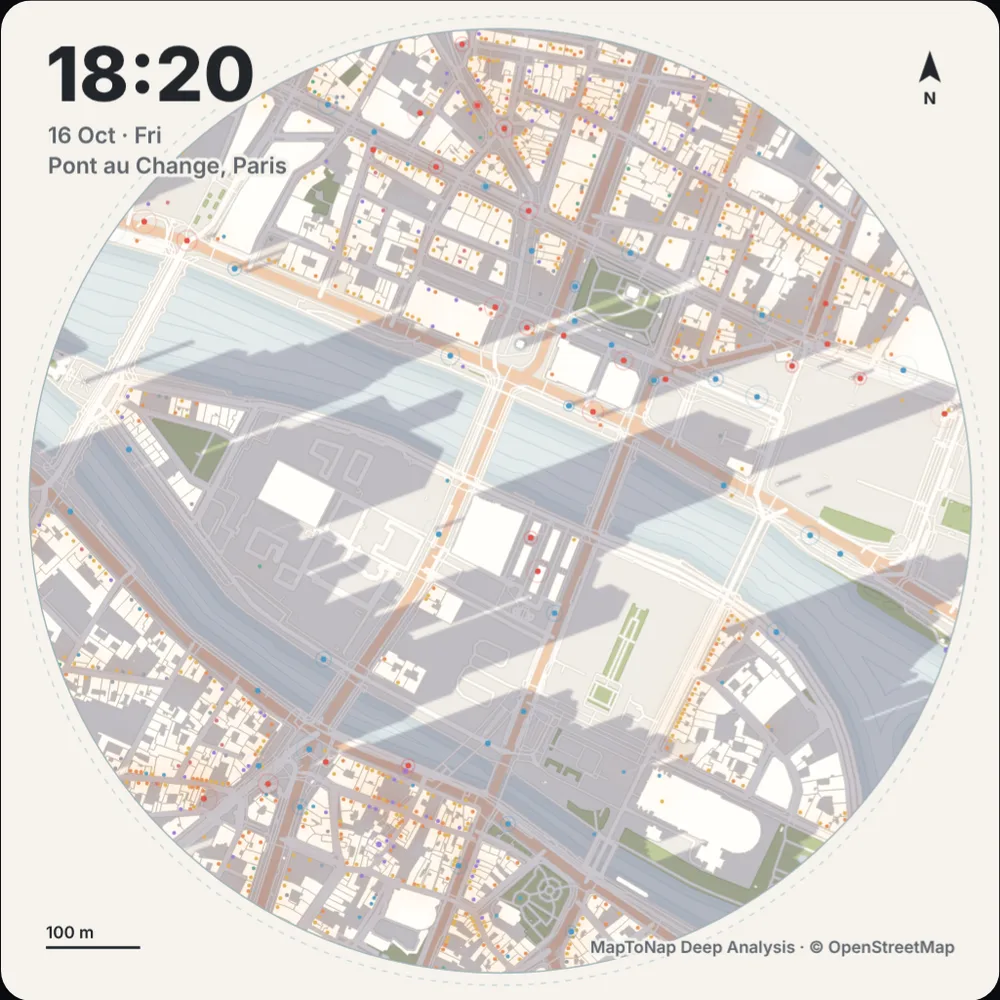
24 hours of real sun position and building shadows on your site, with the shops that are open and the transit that runs, plus a map of the hours of direct sun on every square metre. Exports a 20-second film.
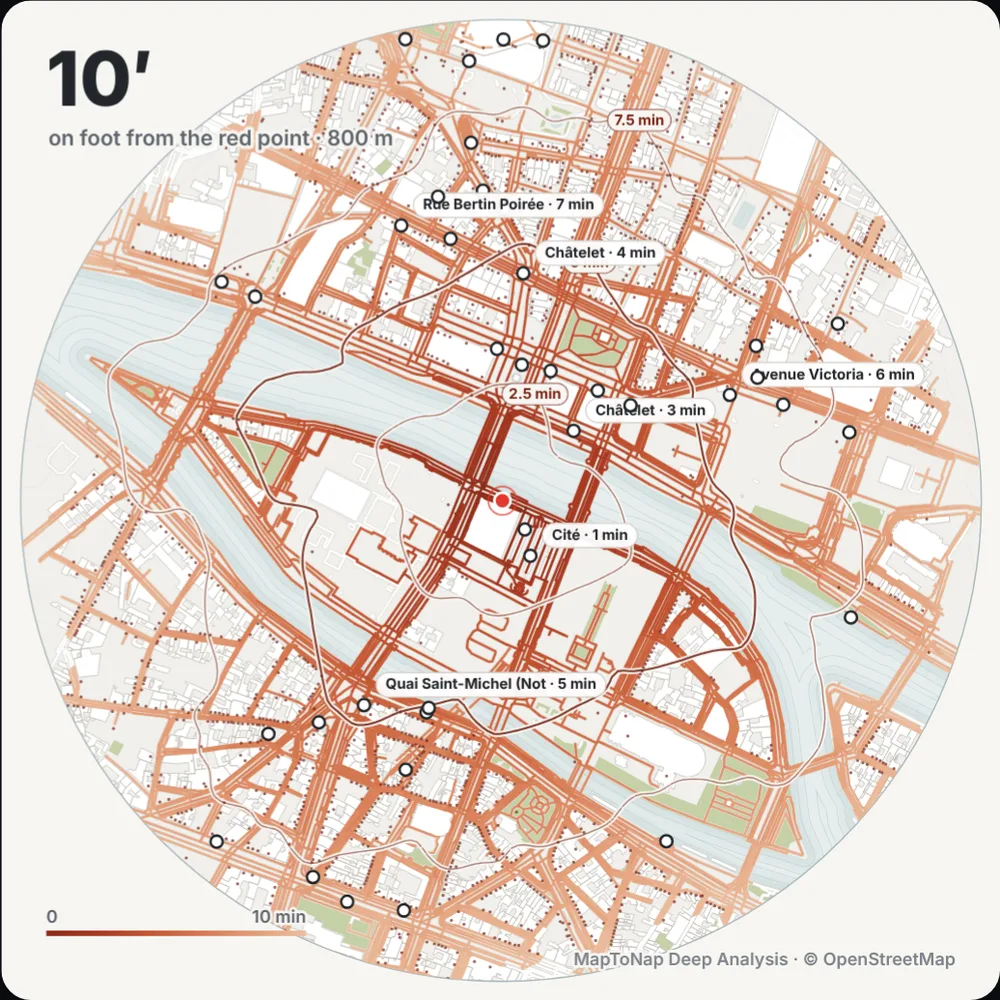
Walking routes drawn along the real street network at walking pace, with the area you can reach on foot from your site minute by minute.
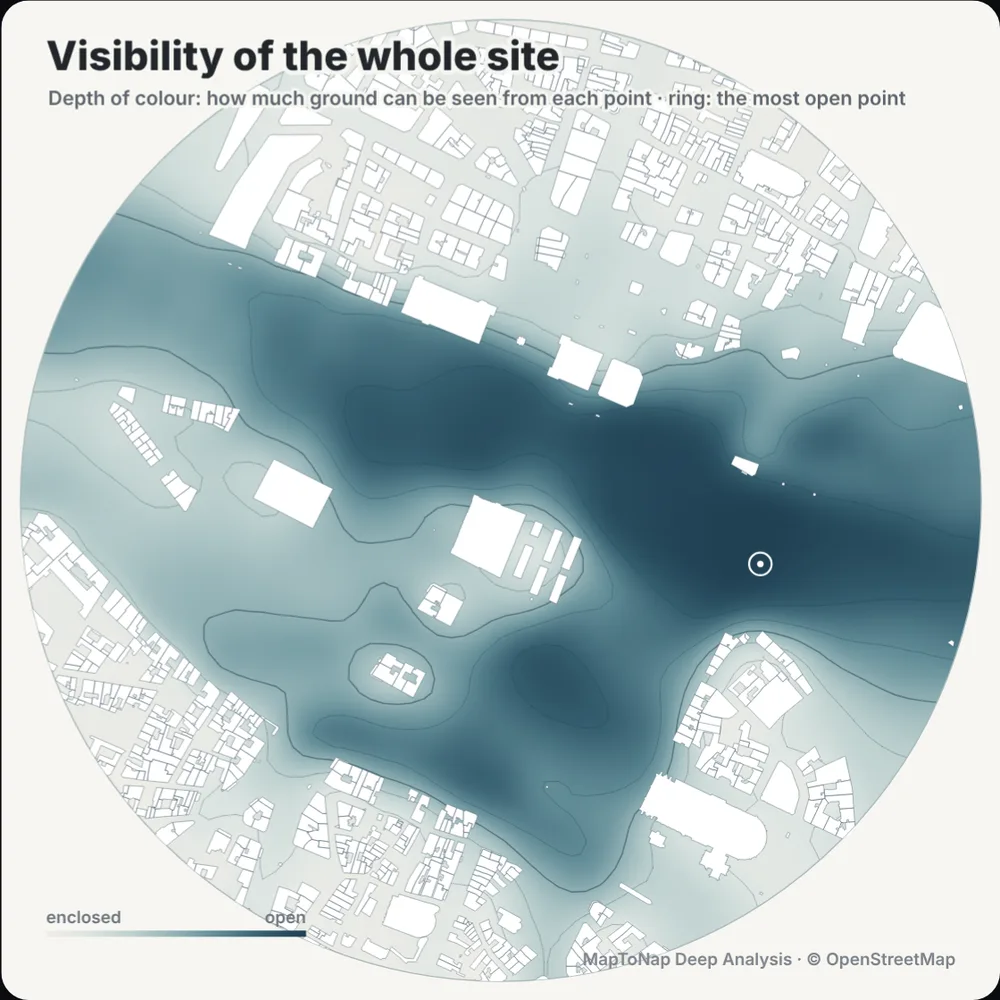
An isovist shows everything visible from one point. A visibility graph analysis (VGA) colours every point of the site by how much can be seen from there.
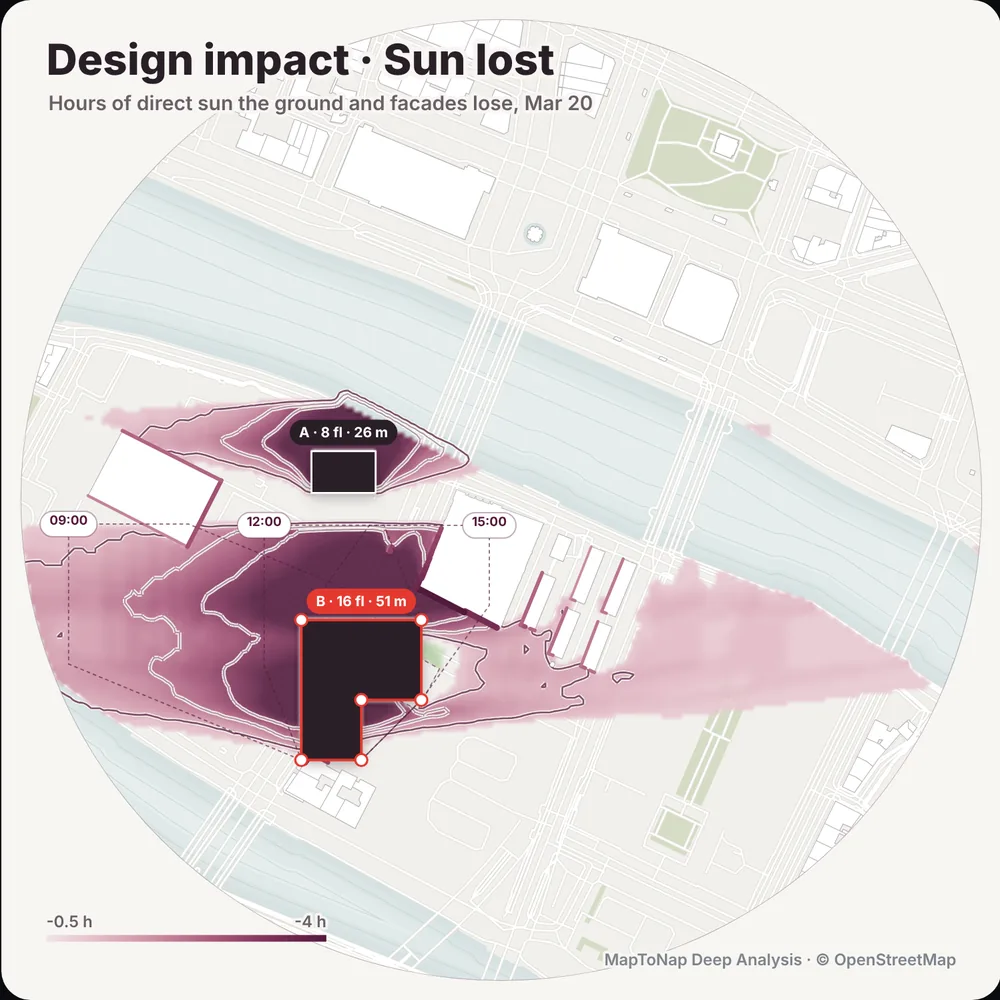
Draw up to eight blocks, each with its own number of floors, and measure the sun hours, views and walking routes they take from the neighbours.
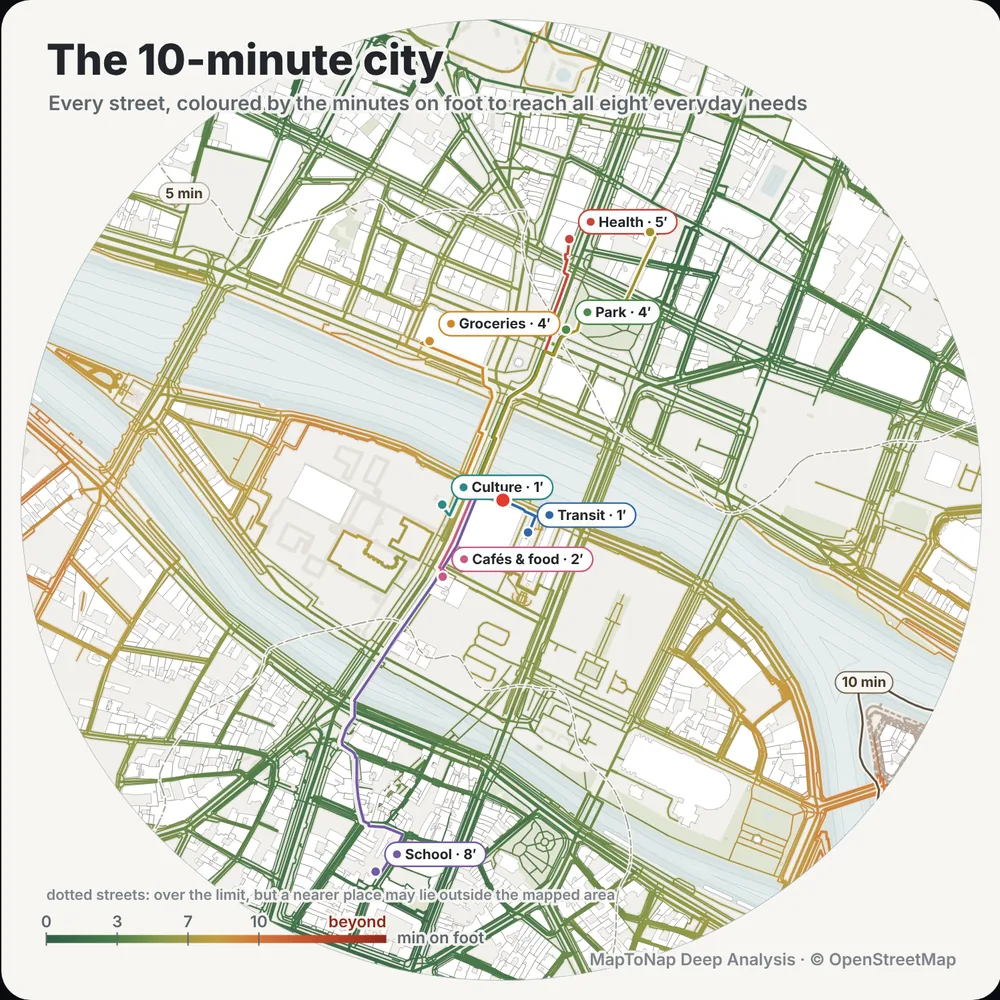
Every street coloured by how many minutes on foot it takes to reach eight everyday needs.
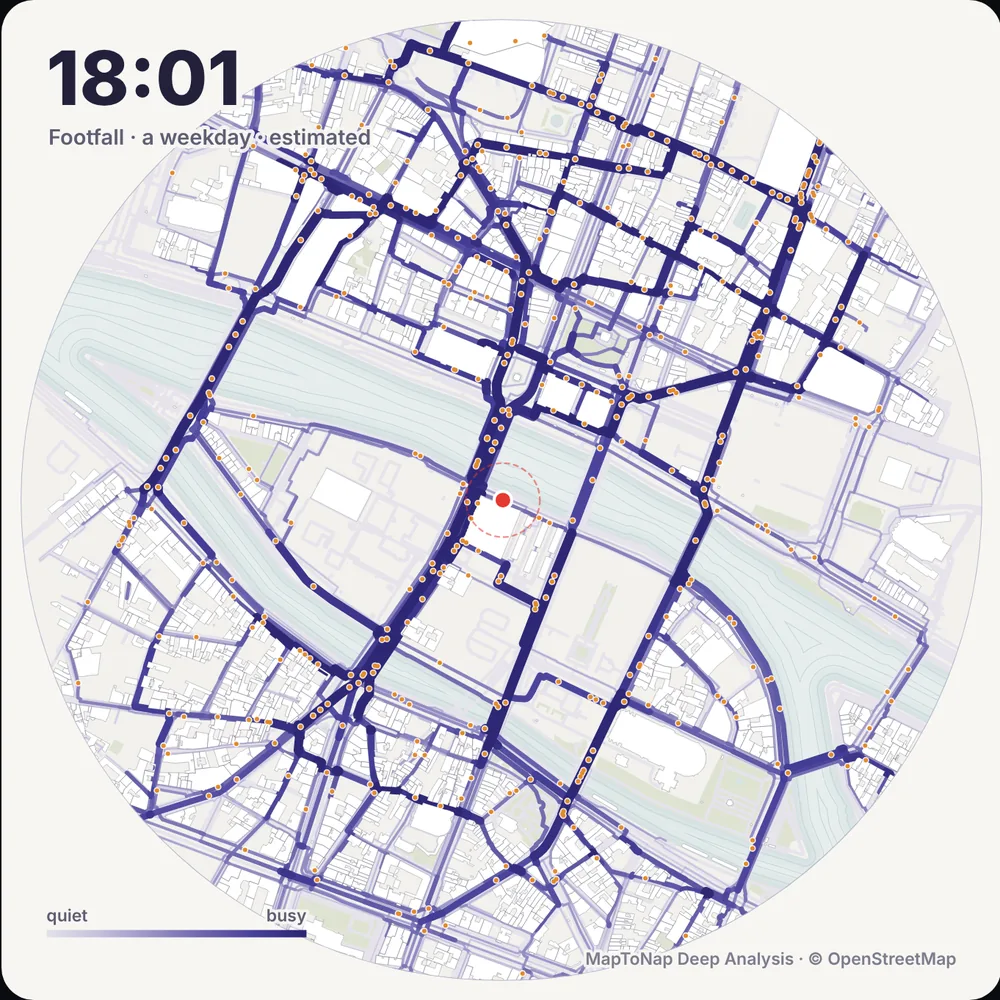
An hour-by-hour estimate of the people walking on each street, for a weekday or a Saturday.
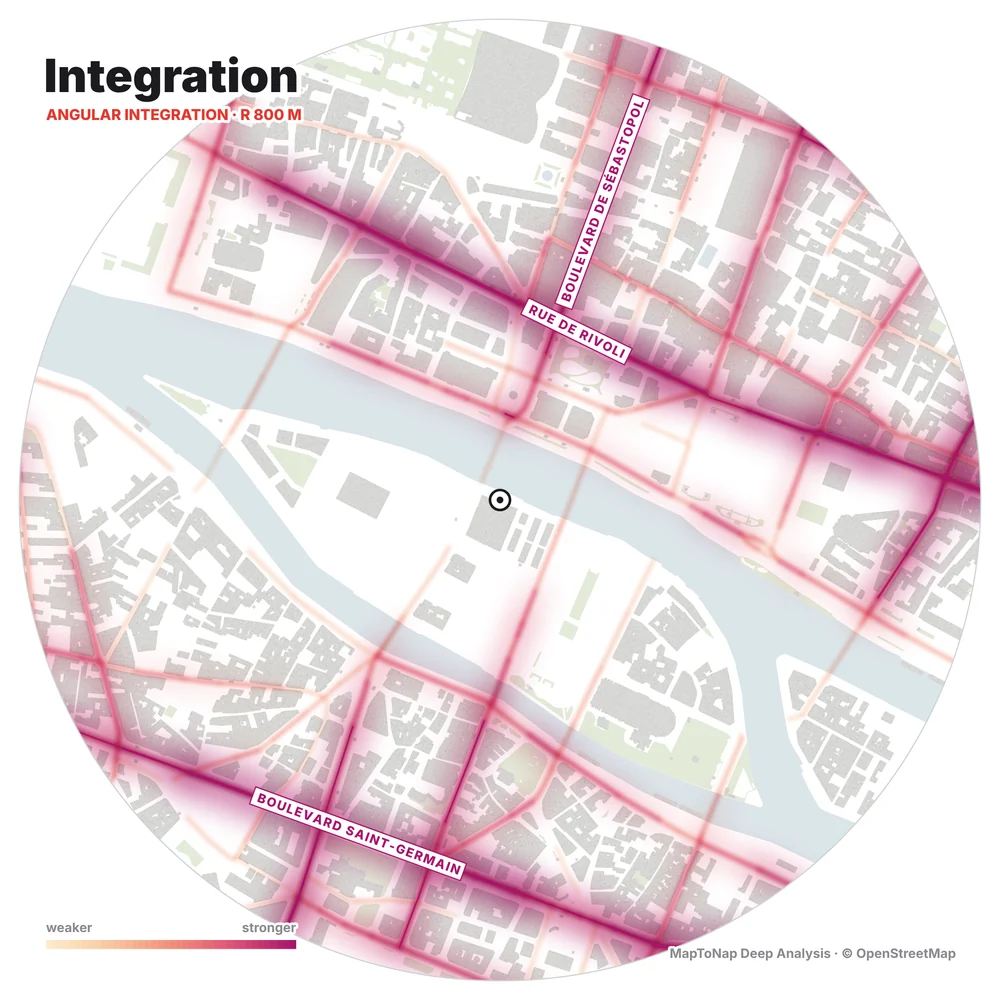
Angular segment analysis of the real street network. Integration shows the streets that are easiest to reach from everywhere around with few turns, where pavements and shops are usually busiest; choice shows the through-routes that the most journeys pass. Read at 400, 800 or 1200 m, computed in your browser in a few seconds, with the strongest streets named on the map.
How the space syntax study works →